
A report has revealed Australia’s slowest and most congested cities
IT’S no surprise Sydney has been named the worst Aussie capital for congestion, but it’s not Australia’s slowest-moving city for drivers.


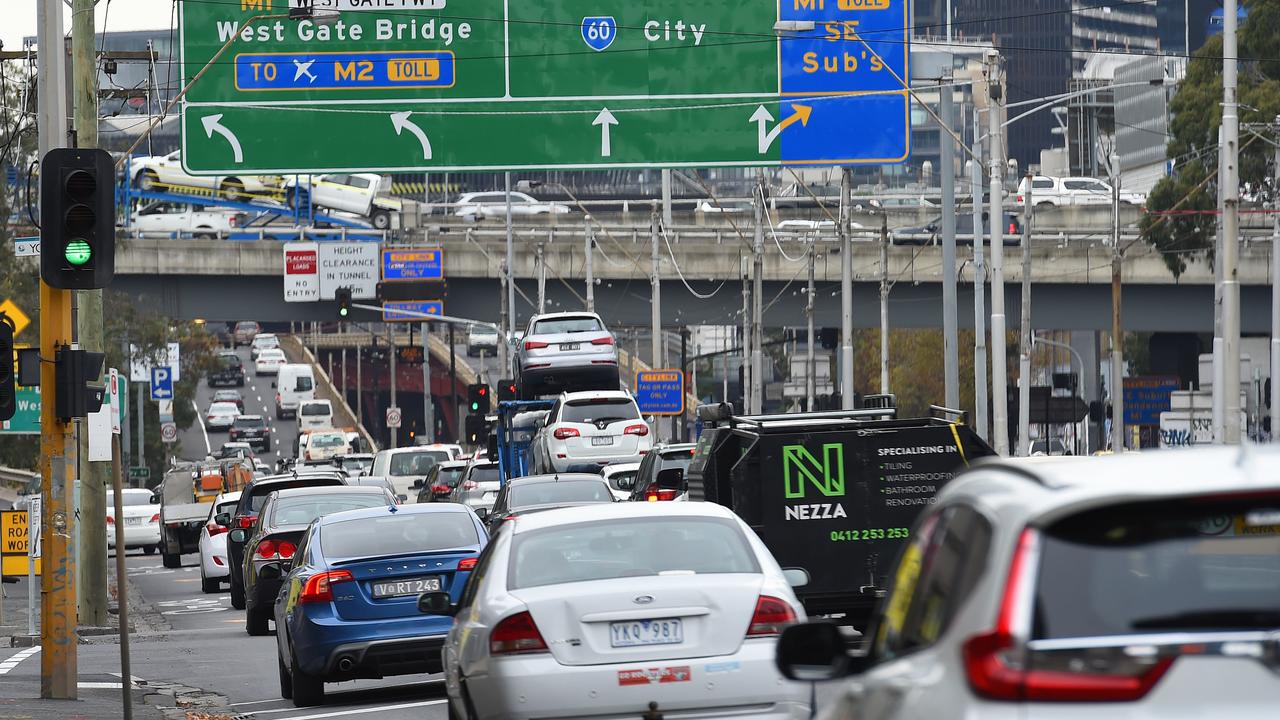
SYDNEY is notorious for its traffic jams and congestion, but a study has revealed it isn’t the country’s slowest-moving city — Adelaide has taken the crown with an average peak hour speed of 54.3km/h.
According to a new report commissioned by the NRMA, Sydney came in second slowest, with motorists averaging speeds of 59.2km/h on its major roads during the morning and evening peaks.
Melbourne was the next city down with average speeds of 59.9km/h. Perth was the fourth worst city followed by Hobart and Canberra.
But the report, Road Congestion In Australia, conducted by the Australian Automotive Association (AAA), found that Sydney is the slowest city when comparing speeds with free-flow speeds — overnight speeds on the same routes with little traffic.
It now takes the average Sydneysider an extra 11 seconds to travel every 5km than it did five years ago.
Anonymous data for the study was collected from smartphones, vehicle sensors, GPS devices and road sensors and covered more than six million road segments.
Darwin and Brisbane had the greatest declines in this congestion from 2017 to 2018.
The report also found that average speeds to Sydney’s Kingsford Smith Airport had fallen almost 6 per cent to 53.6km/h since 2013.
As Sydney is currently experiencing a significant transport infrastructure boom with major roads and public transport projects under construction, NRMA spokesman Peter Khoury said results would come as no surprise to Sydney drivers.
“Sydney has limitless potential as a world-class city to live, play and do business but our ability to keep people moving has the potential to let us down,” Mr Khoury said. “That we were ranked in the bottom three of every congestion benchmark in this report highlights the need for more infrastructure.”
He said while the NRMA supports Sydney’s road infrastructure transformation, “it is vital that these projects are delivered as soon as possible” as the public pay for these projects, meeting expectations is important.
“We need the Sydney Light Rail, WestConnex and the North-West Metro project to be finished quickly for the sake of commuters and motorists and to help boost the economy and tourism.”
CONGESTED AIRPORT ROUTES AND SPEEDS
The Brisbane CBD to airport route was the most congested, followed by the Melbourne and Adelaide airport routes. Canberra, Darwin and Sydney had the least congested airport routes.
Melbourne’s Tullamarine Airport route had the largest increase in congestion over the five-year period.
“This road’s congestion increased by almost 13 per cent over 2013 to 2018 and its variability is still notably higher than on any other airport route,” the report stated.
Over 2017 to 2018, Brisbane Airport’s route had the largest decline in average speed.
Speeds on capital city airports decreased by about 6.1 per cent on average since 2013 with Perth the only city to record an improvement in average speeds.
The Road Congestion in Australia report also found that Darwin has the fastest average speed of all capital cities (72.2km/h) and fastest speed compared to free-flow periods.
Brisbane’s average speeds were highest when compared to the posted speed limits.
WHY IS THIS BAD?
According to the AAA, the report confirms what most people living in and around our capital cities know all too well — traffic congestion is growing worse year after year.
Chief executive of AAA Michael Bradley said business costs rise and productivity declines when workers and goods are stuck in traffic.
“These costs end up being passed on to consumers, feeding into our rising cost of living,” Mr Bradley wrote in the report.
“In 2014-15, land transport congestion cost Australia $18.7 billion.”
AAA research also found that in 2018-19, congestion costs are expected to exceed $23 billion, which will be more than the value of all road-related expenditure.
“Without major policy changes, congestion costs are projected to reach between $30.6 billion and $41.2 billion by 2030,” Mr Bradley said.
Road Congestion in Australia is the first report aimed at benchmarking road congestion in all of the nation’s capital cities.
BEST AND WORST TRAVEL ROUTES TO YOUR CBD
Sydney:
- Sydneysiders travelling to the CBD via inner southwest or the Sutherland routes lost an average 2.7 minutes during the morning peak period
- In contrast, people living in Penrith, Parramatta and Campbelltown gained an additional 1.2 to 1.5 minutes when travelling to the CBD in the morning peak
Melbourne:
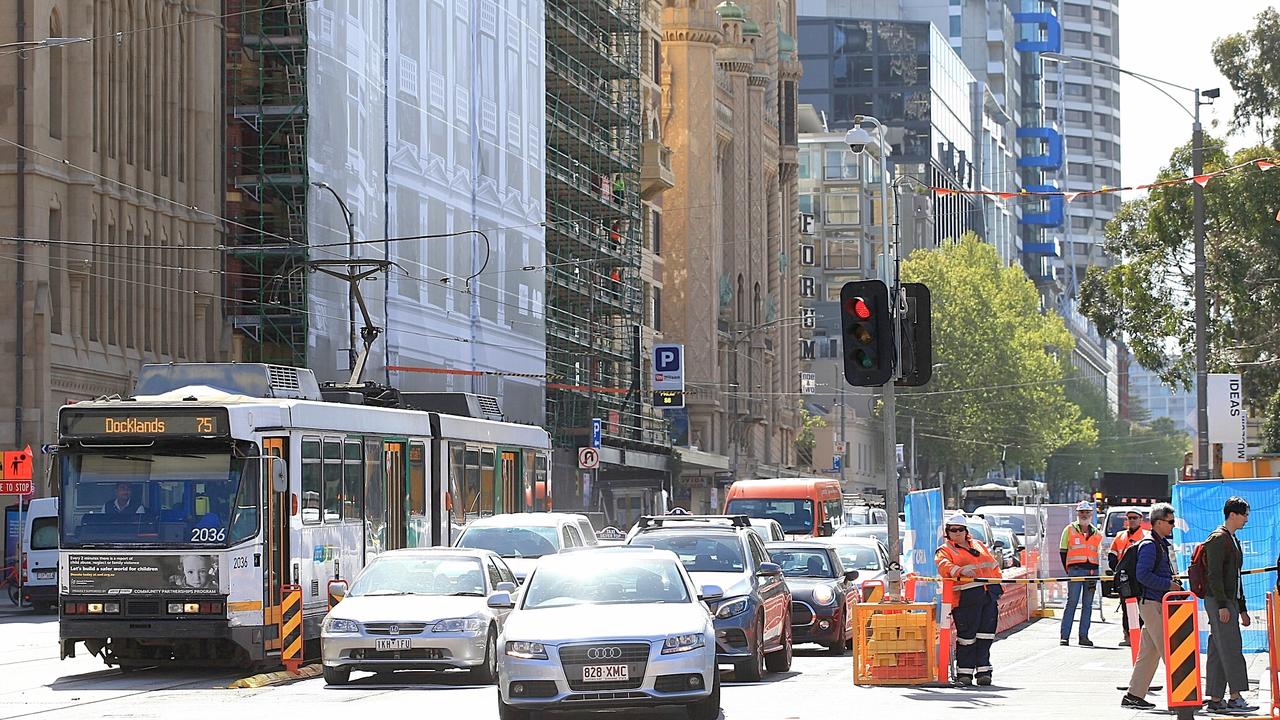
- The Dandenong route to the Melbourne CBD had the greatest increase to average trip times, adding an additional 3.7 minutes to the trip
- Ormond to the Melbourne CBD and Melbourne airport to the CBD also had an additional 3.5 minutes added to the trip due to deteriorating road performance
- Routes from Ravenhall and Hoppers Crossing to the Melbourne CBD, from Kew to Parkville and from Bundoora to Nunawading also had slower trip times over the reference period
Brisbane:
- The Beenleigh-CBD route was among Brisbane’s most congested routes, with an average three minutes lost in the morning peak from 2013-2018
- Similarly, motorists travelling from north to CBD or Brown Plains to CBD lost between 2.4 to 2.2 minutes in morning peak periods
Canberra:
- Canberrans travelling on the Franklin-Barton route lost 1.7 minutes on average, but people travelling from Belconnen to Civic gained 0.1 minutes during morning peak periods
Adelaide:
- Travel time losses were the greatest for the Holden Hill to CBD route (2.2 minutes lost) between 2013-2018
- In contrast, people travelling on the South-CBD route gained an average of 2.6 minutes in morning peak periods from 2013-2018
Perth:
- The northeast to the CBD route had the worst deterioration in trip time — 3.5 minutes. The second largest decline was in the Armadale to CBD route — 1.9 minutes lost
- The airport to CBD route was the only route that improved — a 0.5 minute gain
Hobart:
- The Sorell to Hobart CBD route had the greatest increase in travel time — motorists lost an average of 2.2 minutes in morning peak
- People using the Glenorchy to Hobart CBD route lost an average 1.2 minutes
- Only Claremont to Hobart CBD reported a travel time gain — 0.2 minutes
Darwin:
- The Darwin North to CBD route had the worst increase in travel time — an average 1.2 minutes lost in the morning peak periods from 2013 to 2018
- The Wagaman to CBD route also had a slower travel time, with an average one minute added to the trip
- Litchfield to CBD route had a quicker travel time, with motorists gaining an additional 0.9 minutes on average
‘Alexa, I’m being pulled over’
Amazon is introducing a new dashcam gadget with voice activation to start recording interactions when you pulled over by the police.
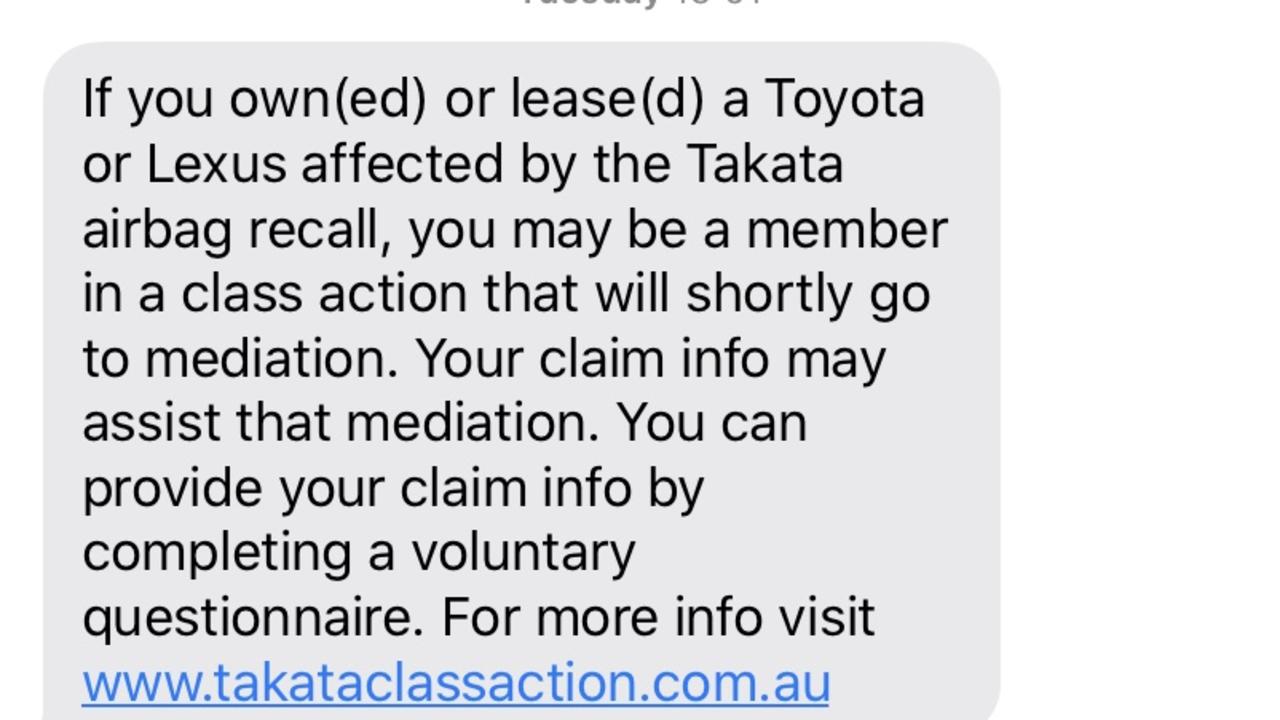
Text two million Aussies have received
Australia’s largest class action in history is brewing with more than two million Aussies urged to take part in the landmark case.
Words you can’t have on your plates
The fight over a barrister’s Lamborghini shows even if you pay for a personalised plate you’re not guaranteed to get what you want.