Mazda, Ford, Holden buck the green trend
Australia’s appetite for SUVs has put the brakes on reducing submissions.
SOME of Australia’s biggest brands increased their average CO2 emissions last year.
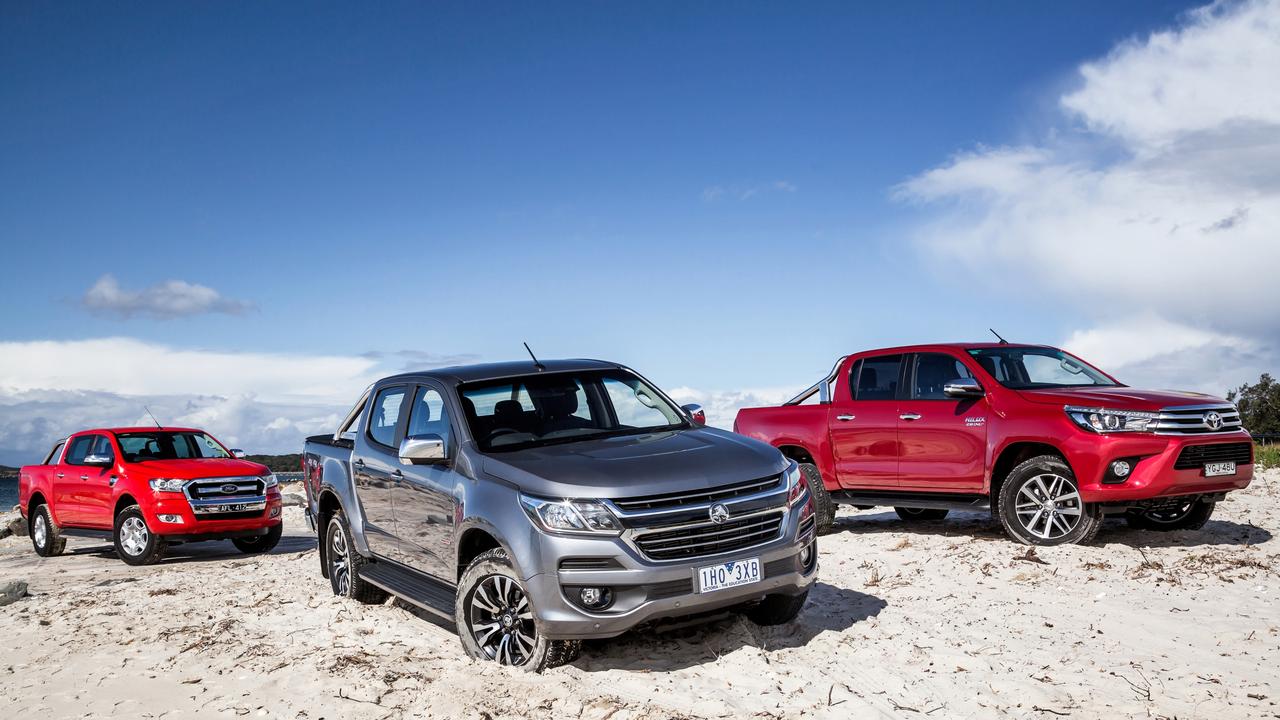
Among the top 10 brands, Mazda, Ford and Holden bucked the trend towards greener cars in 2016, according to the latest vehicle emissions report by the National Transport Commission.
Mazda blames record sales of its BT-50 ute and a buyer shift from small cars to SUVs for the result.
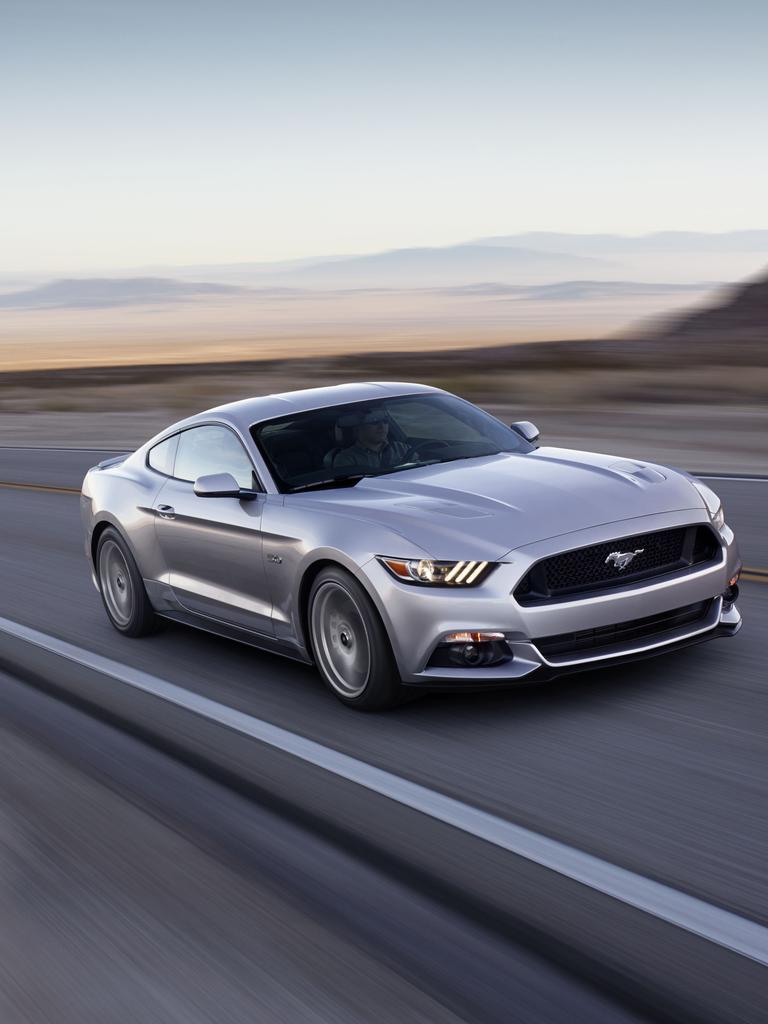
For Ford and Holden, V8s were the culprits. Enthusiasts rushed to buy performance Falcons and Commodores before local factories shut.
Ford was also the largest contributor to the increase in the emissions of sports cars — the biggest upsurge of any vehicle category in Australia last year, up by 13 per cent — largely due to the popularity of the Mustang V8.
More than 6200 Mustangs were sold here in 2016. The previous year the four-cylinder Toyota 86 led that segment with 3000 sales.
The report also revealed a stark contrast between the emissions of cars sold by each automotive brand in Australia versus Europe.
Brands such as Toyota, Holden (General Motors), Nissan, Ford and Hyundai each had more than 50 per cent higher emissions for their vehicle fleets sold in Australia than in Europe.
Part of the reason for that trend is the popularity of work utes — the Toyota HiLux was the country’s most popular vehicle last year, while the Ford Ranger was ranked fourth.
Cars on Australian roads belched out on average up to 50 per cent more toxic fumes than those in Europe last year.
In 2016 the national average emission for passenger cars, SUVs, utes and vans was 182 grams per kilometre. Europe’s average was 120g/km.
Had Australians bought the most efficient cars in each class, the national average vehicle emissions would be just 75g/km, a reduction of 59 per cent on the previous year’s figure.
Government fleets are among the biggest polluters, despite preaching the “green car” message to private buyers.
In a major embarrassment for government at all levels, the local, state and federal fleets were among the five worst polluters.
The commission says: “Private buyers purchased vehicles with the lowest average emissions intensity (176g/km), followed by business buyers (187g/km) and government buyers (201g/km).”
State government fleets had the highest emissions (204g), ahead of their federal counterpart (200g) and councils (195g/km).
Australia’s tailpipe emissions have come down by 28 per cent over the past 15 years. However, they appeared to plateau from 2015 to 2016, with a modest drop of just 1.1 per cent — the smallest decline since 2002, when figures were first reported.
Our national vehicle emissions over the past two years fell by less than half the rate of Europe.
Experts say our appetite for bigger, thirstier cars with higher emissions is largely fuelled by cheaper prices at the bowser.
Australia has the fourth cheapest petrol in the world and the sixth cheapest diesel — and among the lowest taxes — according to Australian Institute of Petroleum figures for the final quarter of 2016.
NOT SO GREEN
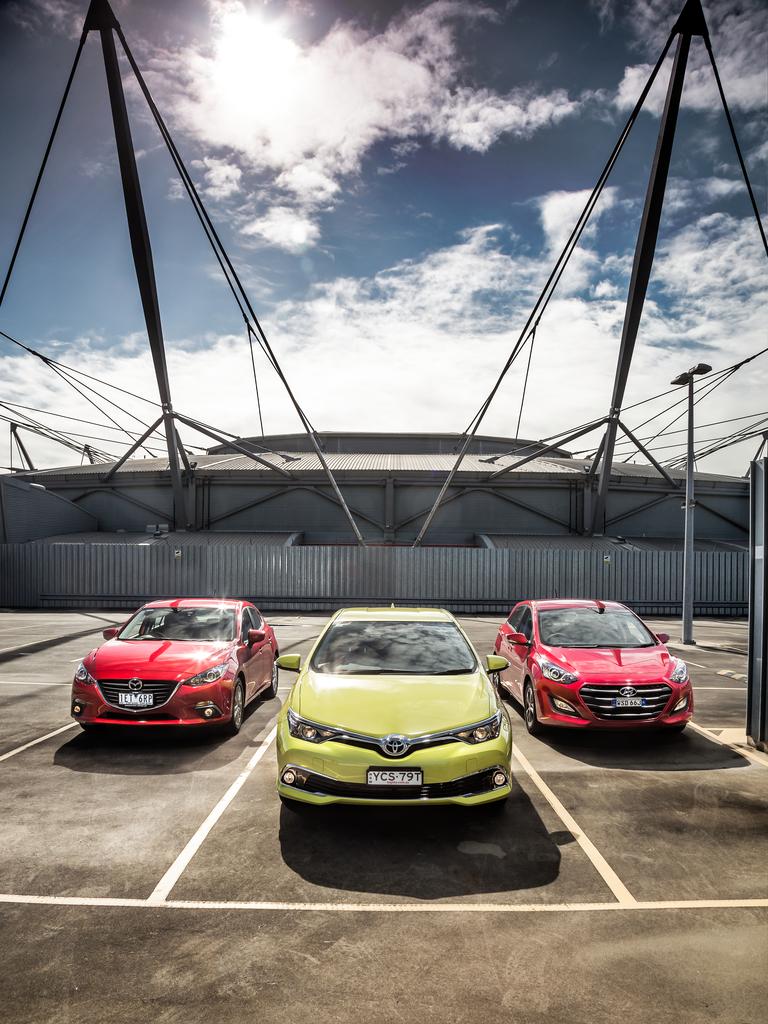
Last year, there were 51 “green” car models — defined as not exceeding 120 g/km — on sale in Australia and they accounted for 2.5 per cent of total new-car deliveries. The previous year there were 72 models, tallying 4.7 per cent of deliveries.
GO FIGURE
The report is not based on actual vehicle emissions, which depends on factors such as distance travelled, and the nature of road and traffic conditions. Instead, the laboratory-tested emissions average for each model — and a detailed list of who buys them — is supplied to the National Transport Commission by the Federal Chamber of Automotive Industries, the car industry lobby group.
HOME-MADE
In 2016 the average carbon dioxide emissions for Australian-made cars was 213g/km, a 2.3 per cent increase over the previous year. Of the three brands, Toyota had the lowest emissions (175g/km), then Holden (233) and Ford (234).
TOP 10 BRANDS ... AND THEIR EMISSIONS
MAKE (g/km)
Toyota 198
Mazda 158
Hyundai 174
Holden 222
Ford 213
Mitsubishi 184
Nissan 184
Volkswagen 154
Subaru 177
Kia 178
Australian average 182; European average 120


