
Simple maths question only half of teens can answer
Are you smarter than a 15-year-old? A “basic” maths question that stumped more than half of Year 9 students has gone viral online.


A simple mathematics question that only half of 15-year-olds across the world were able to answer correctly has gone viral online, sparking discussion about declining educational standards.
The question from the 2012 Programme for International Student Assessment (PISA), a test conducted every three years across more than 80 countries in the Organisation for Economic Co-operation and Development (OECD), asked high-schoolers to interpret a simple table comparing four different cars.
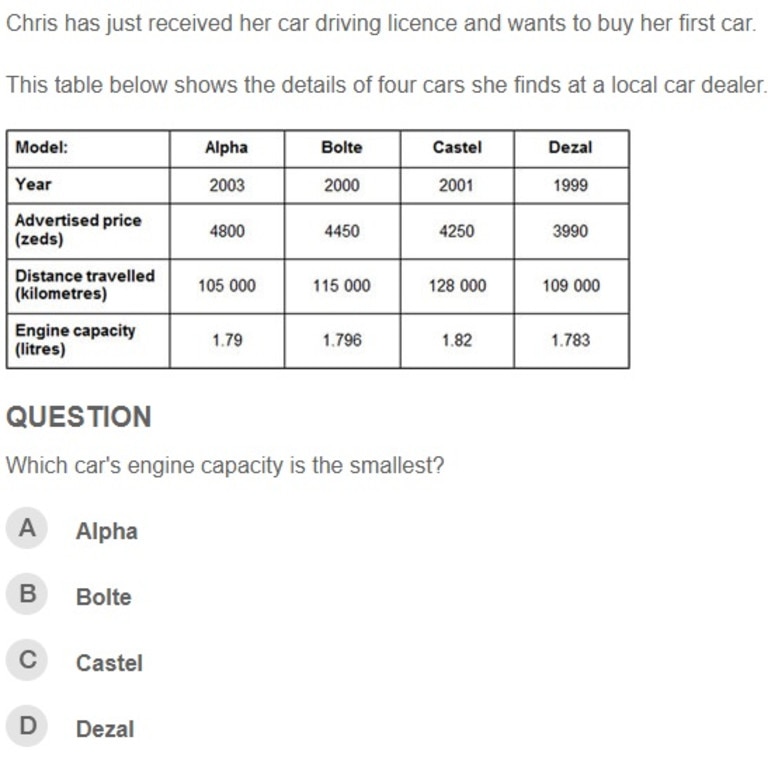
The table, comprising four rows and four columns of data, displayed the year, advertised price, kilometres travelled and engine capacity in litres of each model.
Question 2 of the “Which Car?” problem asked, “Which car engine’s capacity is the smallest?” — Alpha (1.79), Bolte (1.796), Castel (1.82) or Dezal (1.783).
On average, just over half of students answered correctly.
Only 55% of people worldwide got this simple table reading question from the 2012 international PISA exam correct
— Jeremy Kauffman 🦔 (@jeremykauffman) July 31, 2024
About half the world struggles to read graphs or do basic data interpretation https://t.co/ALXlxLbmzqpic.twitter.com/ZFjxTLtl0S
“Only 55 per cent of people worldwide got this simple table reading question from the 2012 international PISA exam correct,” blockchain entrepreneur Jeremy Kauffman wrote on X.
“About half the world struggles to read graphs or do basic data interpretation.”
Question 1, by contrast, required students to pick a car from the table which met three conditions — a distance travelled not higher than 120,000 kilometres, made in the year 2000 or later and at an advertised price not higher than 4500.
More than 92 per cent answered Question 1 correctly.
Question 3 was considered the hardest, requiring students to calculate a percentage of a car’s sale price in taxes.
Only 30.8 per cent of students got it right.

“Question 1 was allocated to the uncertainty and data content category,” the OECD said in its report summarising the 2012 PISA results.
“The item requires knowledge of the basic row-column conventions of a table, as well as co-ordinated data-handling ability to identify where the three conditions are simultaneously satisfied. While the solution also requires basic knowledge of large whole numbers, that knowledge is unlikely to be the main source of difficulty in the item.
“In contrast, Question 2 has been allocated to the quantity content category because it is well known that even at age 15, many students have misconceptions about the base ten and place value ideas required to order ‘ragged’ decimal numbers.
“Question 3 is also allocated to the quantity content category because the calculation of 2.5 per cent is expected to require more cognitive effort from students than identifying the correct data in the table.
“The difficulty for this age group in dealing with decimal numbers and percentages is reflected in the empirical results — Question 1 is considered an easy item, Question 2 is close to the international average, and Question 3 is of above-average difficulty.”
Kauffman’s post on X has been viewed more than four million times since Wednesday.
“Wait … what? How could one not answer this?” one person commented.
“Fifty per cent of people have below-average intelligence,” another said.
But one suggested, “Perhaps they didn’t care about getting the correct answers?”
Earlier this year, data obtained by The Guardian found more than three quarters of Australian students said they “didn’t fully try” in the latest PISA tests, conducted in 2022.
The unpublished data, provided to Save Our Schools by the OECD, suggested “student disaffection with learning and school” could be a crucial factor behind declining test results in many countries, according to Trevor Cobbold, national convener of the public education advocacy group.
More than 690,000 students from 81 countries took part in the 2022 PISA test, which provides the most comprehensive global rankings in science, reading and mathematics.
In Australia, 13,437 students from 743 schools took part.
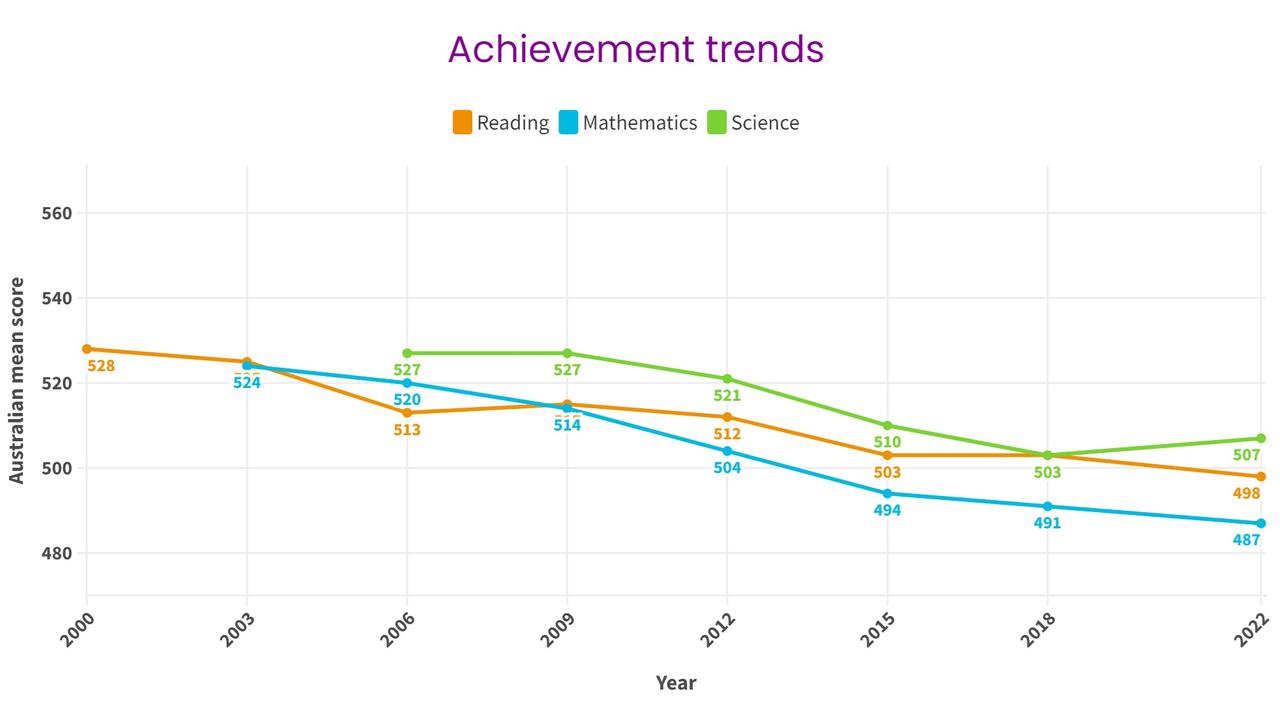
Australian PISA scores have steadily declined across all three domains since the first tests in 2000.
Other countries’ poor performances in 2022 meant Australia climbed into the top 10 of OECD countries, despite test scores Down Under continuing their long-term decline.
Australia scored above the OECD average in all three categories, with 57 per cent of students proficient in reading, 51 per cent in mathematics and 58 per cent in science.
The OECD average was 49 per cent in reading, 46 per cent in mathematics and 50 per cent in science.
Singapore again topped all three categories, scoring far above the OECD average — 74 per cent in reading, 81 per cent in mathematics and 78 per cent in science.
Average PISA test scores across the OECD have all declined over the past two decades, with a record drop in mathematics of 15 points between 2018 and 2022.
“Reading fell 10 points, twice the previous record, whereas science performance did not change significantly,” the OECD stated.
“On average, reading and science trajectories had been falling for a decade, though math had remained stable between 2003-2018.”
The OECD found socio-economic status was closely correlated with mathematics proficiency.
“Socio-economically disadvantaged students in OECD countries are seven times more likely on average than advantaged students not to achieve basic mathematics proficiency,” it said.
Covid-related school closures have been partially blamed for the falling test scores.
“Scores on an international math test fell a record 15 points between 2018 and 2022 — the equivalent of students losing three-quarters of a school year of learning,” according to The Hechinger Report.
“That finding may not be surprising considering the timing of the test. The world was still recovering from the disruptive effects of the global pandemic when the test was administered.”
Too much screen time has also been found to affect test scores.

“Students who said they were distracted at least some of the time in school by their peers using devices scored 15 points lower than students who reported that they never, or almost never, were distracted,” The Hechinger Report noted.
“Outside the classroom, digital device use also matters when it comes to math scores. Students who spent more than an hour on weekdays surfing the web or on social networks scored between 5 and 20 points lower than peers who spent less than an hour on devices.”

Mum threatens to ‘slit’ alleged bully’s throat
Shocking footage has emerged of a mum storming into a year eight classroom to deliver a foul-mouthed tirade against a student.
50 boys leave as elite school goes co-ed
Dozens of students have left a presitigious Australian boys school as it pushes ahead with plans to go co-ed from 2026.

Warning to parents over new bullying trend
The Australian Federal Police have issued an urgent warning over a concerning rise in a child abuse material trend being used to “embarrass or bully classmates”.