
US election: Key data predicts the next president better than polls
After the shock of the US and Australian elections, many doubt the accuracy of polling data. But there’s a greater indication to reveal who will win.
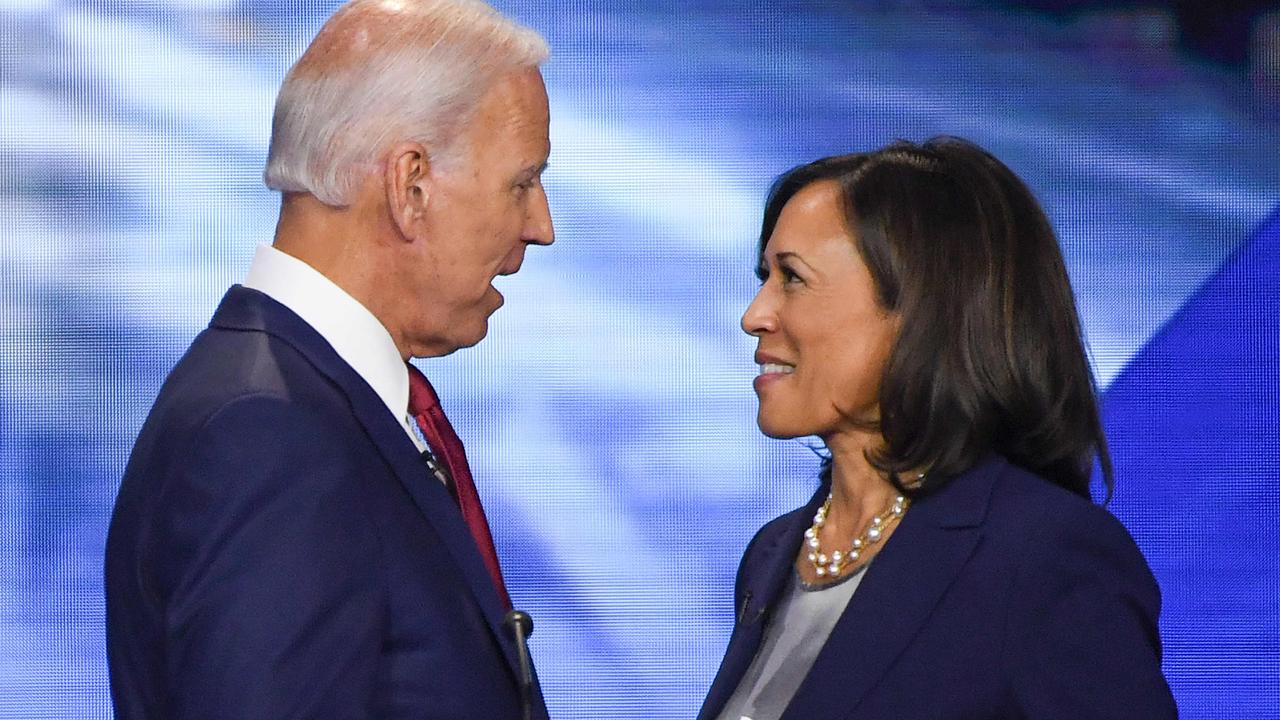
Joe Biden, the Democratic challenger in November’s US presidential election, has finally picked his candidate for vice president: Kamala Harris.
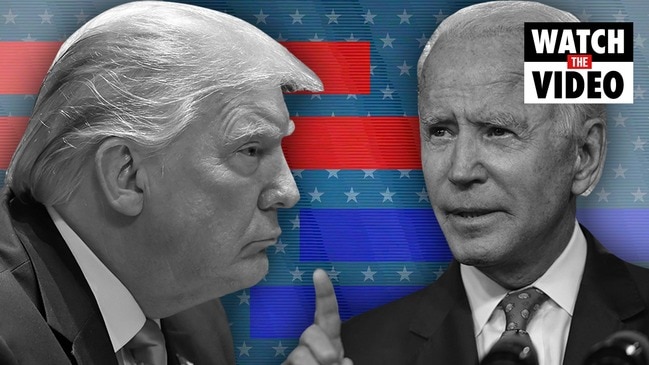
Has picking Ms Harris, who was born in California to a Jamaican father and Asian-American mother, improved Mr Biden’s chances of winning the election? Or has it actually improved the chances of Donald Trump to get re-elected?
Depending on who you ask, the answer can vary significantly and an objective answer is hard to come by. Polls or approval ratings could help – the latest poll aggregation puts Mr Biden in the lead with 50 per cent versus 41 per cent for Mr Trump with the rest of voters undecided.
But prediction markets, simple financial markets where the value of the traded assets depends on outcomes such as who wins an election, have been shown to be better longer-term predictors of election outcomes.
Anyone can trade in these markets and firms can also use them to insure against political risks. Some companies even use prediction markets to forecast political changes, the demand for new products or the feasibility of project deadlines.
Mr Biden’s chances of winning the November election were given a boost on prediction markets when he announced Ms Harris as his running mate.
RELATED: How Trump compares to other one-term presidents
HOW PREDICTION MARKETS WORK
Prediction markets operate in the currency of the country in which they are based, say for example US dollars. For the US election, markets trade a Trump-asset, which pays out $1 after the election if Mr Trump wins, and $0 otherwise. The Biden-asset pays out $1 if Mr Biden wins, and $0 otherwise.
Prediction markets always price these events between $0 and $1. This means the price of an asset can be interpreted as a probability of an event occurring. So if the Trump-asset trades at $0.4, then Trump has a 40 per cent chance of victory.
It does not mean that “Trump is going to lose the election” – it means he is the underdog and will probably, but not certainly, lose. And the market quantifies these chances. However, whatever the market price, the investor will still either get only $1 or $0 after the election results are announced.
If most traders think an asset is overpriced, because the price exceeds the candidate’s chances, then they will sell and the market price will drop.
Conversely, if most traders think an asset is underpriced, they will buy and the price increases. So, the market prices are a prediction of the election outcome based on the wisdom of crowds, a consensus forecast that tends to be better than the forecast of single experts.
RELATED: US urges Australia to join China push back
We know that prediction market prices match the underlying probabilities because empirical and lab research has looked at thousands of such market predictions, grouped all with a price of $0.4 together, and found that the predicted event underlying the asset, for example, the election of a particular candidate, did indeed occur in 40 per cent of these cases.
Similarly, for prices of $0.5, the underlying event occurred in 50 per cent of cases, and so on. The prices are well-calibrated as probability forecasts.
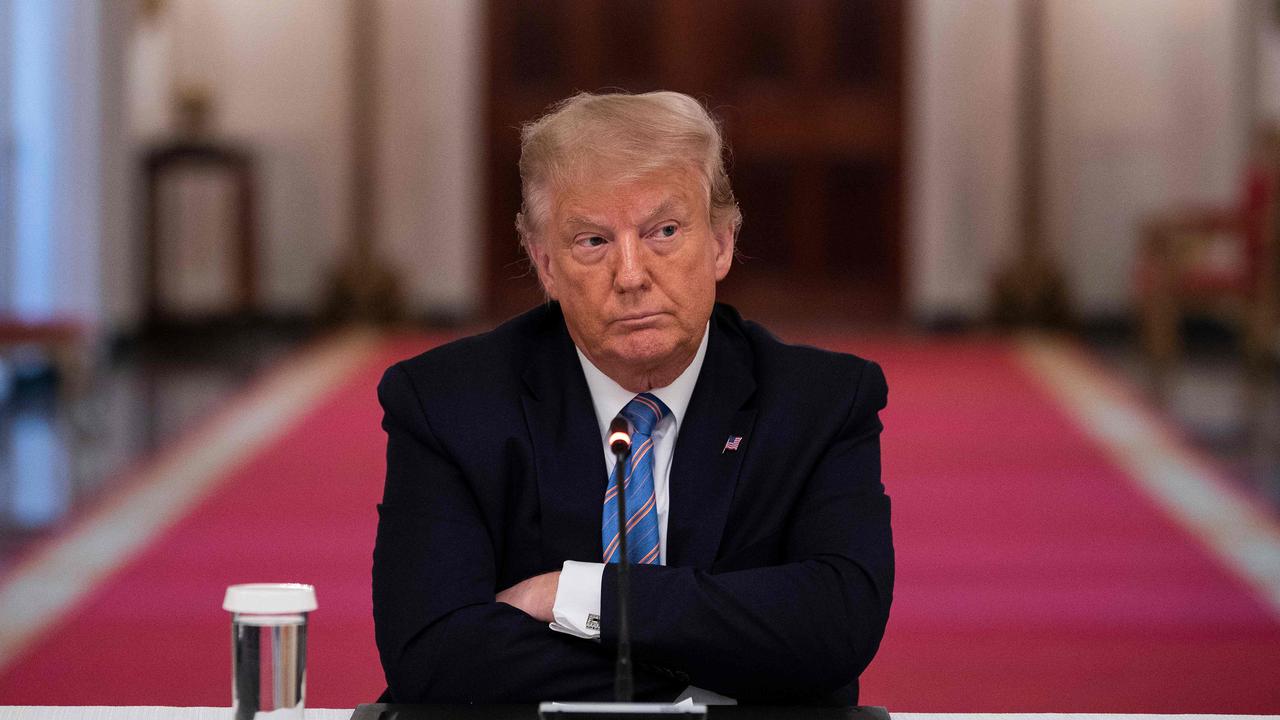
TRUMP’S CHANCES
The biggest prediction market about the US election, which is based in New Zealand, predicts a 41 per cent chance of Mr Trump winning the election, and Mr Biden is a strong favourite at 59 per cent. On August 11, the day of the Harris VP announcement, Mr Biden’s chances jumped by 2 percentage points while Trump’s dropped by 2.
The market clearly thinks Harris was a good choice and increased Biden’s chances of winning the election. This day was also the day with the highest trading volume in the past few months, making it one of the most important events in the campaign.
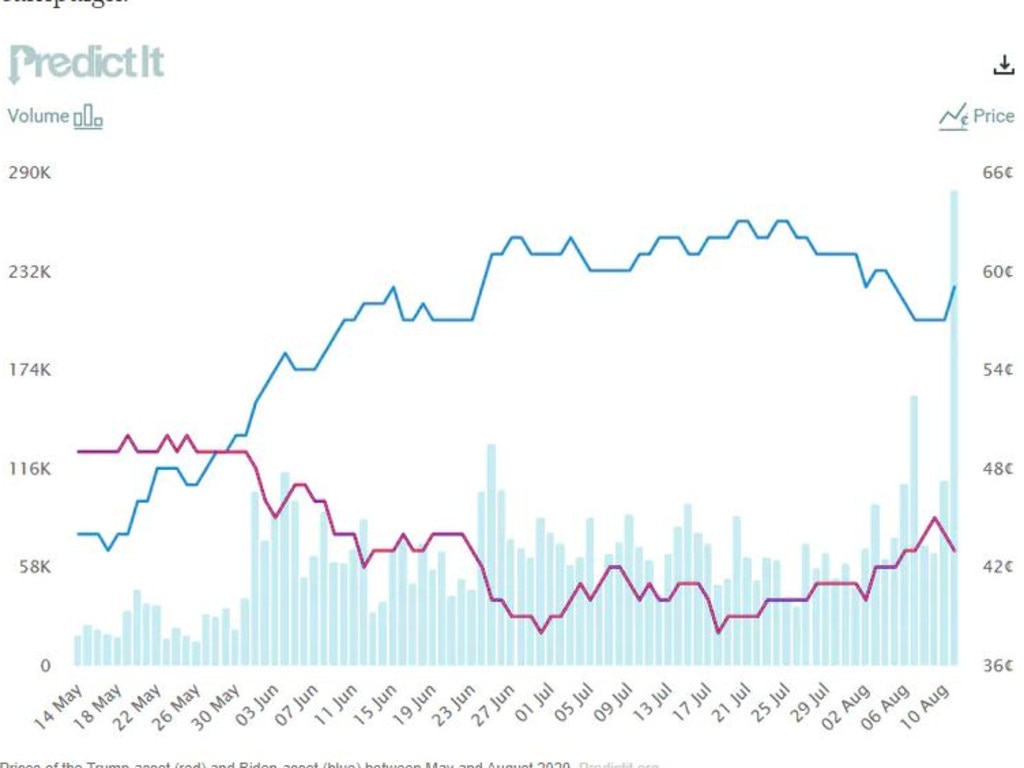
Before that, the price graph shows that Mr Trump’s chances slipped considerably in June. In early May, the market still viewed Mr Trump as the favourite, with Mr Biden not impressing during the Democratic primary race.
But since the dual crisis of the COVID-19 pandemic and Black Lives Matter protests (including Mr Trump’s reactions to them) became the main issues in US politics, Mr Trump has been losing ground steadily, and Mr Biden overtook him as favourite.
Which events led to this reversal? On May 28, Mr Trump threatened to bring in the National Guard to confront Black Lives Matter protesters, using the widely criticised “when the looting starts, the shooting starts” quote, prompting Twitter to flag the tweet as “glorifying violence”. On June 1, protesters were dispersed by force so that Mr Trump could walk to a church for a photo-op. Prices at that time show that within just a few days, Mr Trump lost about 5 percentage points while Mr Biden gained 5, changing the difference by 10 percentage points in favour of the challenger.
COVID news also had a significant impact. On June 24-25, Mr Trump lost another 4 percentage points, widening the gap to Biden by 8.
During these two days, Anthony Fauci, director of the US National Institute of Allergy and Infectious Diseases testified that the US had a “disturbing” surge in new cases, showing the US was not dealing well with the crisis.
In late July, Mr Trump recovered a few percentage points as attention shifted slightly to his anti-China rhetoric and the sale of Chinese social media platform TikTok.
But the race is not over. In the 2016 election, prices moved the most in the two months just before the election. Mr Trump trailed Hillary Clinton in prediction markets throughout the campaign and was seen as favourite only on election day – showing that the underdog can recover. So despite Mr Trump’s poor position now, he might still regain some ground.
CEO wants a ban on common meeting habit
JPMorgan CEO Jamie Dimon has called out staff over a common “time wasting” activity, saying it has to “stop” immediately.

‘He’s scary’: Brutal verdict on Peter Dutton
Voters have delivered a brutal verdict on Peter Dutton which shows why some are turning on the Liberal leader.
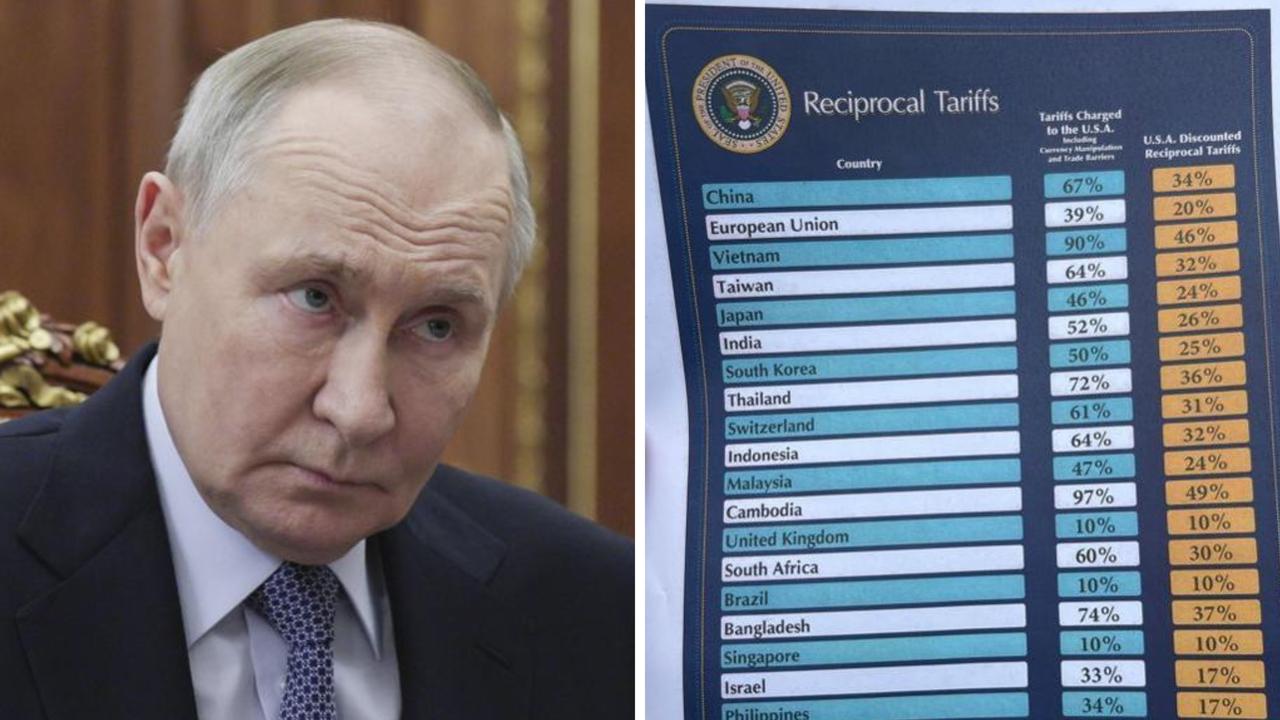
Why Russia was missing from Trump’s list
The White House has clarified its eyebrow-raising decision to keep Russia off President Donald Trump’s sweeping “Liberation Day” tariffs list.