
HILDA report reveals Australian city with the highest median household income
SYDNEY might be full of silvertails but when it comes to median earnings it’s lagging behind other capitals in the income race.


IF YOU had to hazard a guess at the Australian city where, on average, its residents were paid the most, where would you pick? Sydney, maybe? Or perhaps Melbourne?
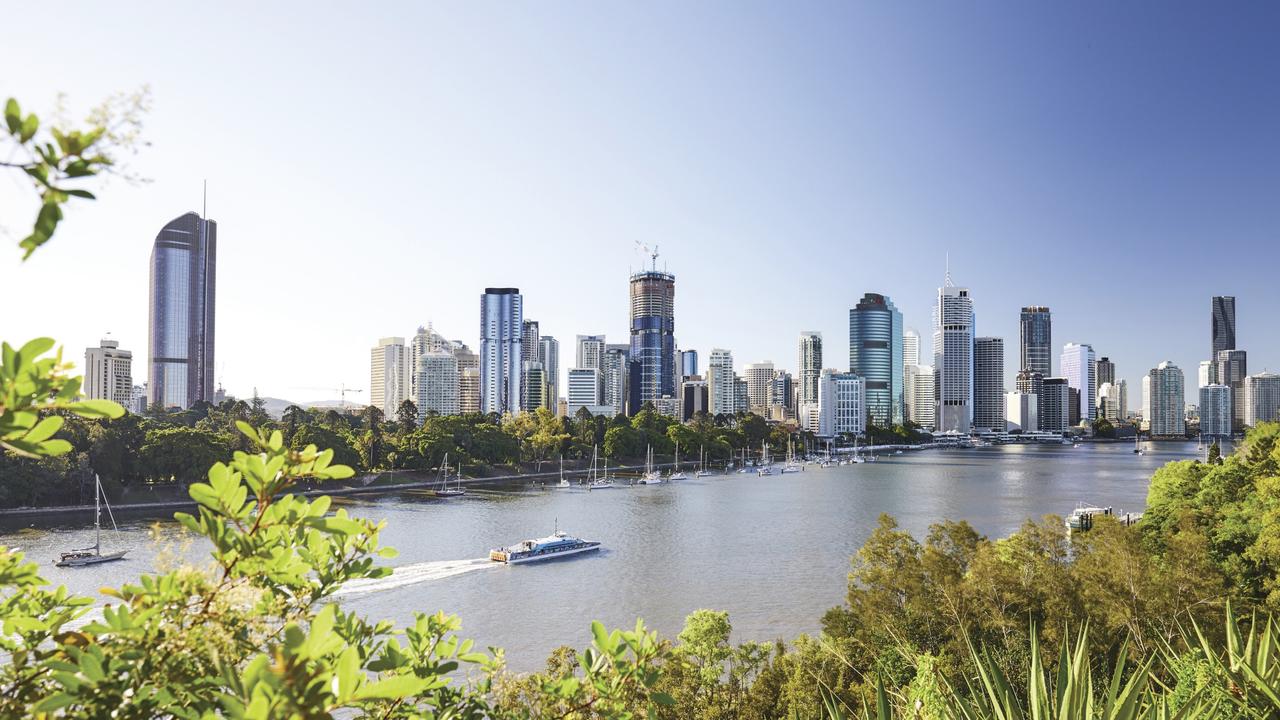
You’d be wrong. According to a wide-ranging new analysis, of the five mainland state capitals it’s actually people living in Brisbane who now have the highest median income.
And while wages have generally gone up in the capitals, residents of Perth have seen a big cut in their pay packets.
The insight came in Tuesday’s release of the annual Household, Income and Labour Dynamics in Australia survey, known as the HILDA report.
The University of Melbourne research also found Australians had cut down on their energy usage in the face of rising power bills, increasing numbers of younger people are choosing not to get a driving licence and there are big gaps in income inequality.
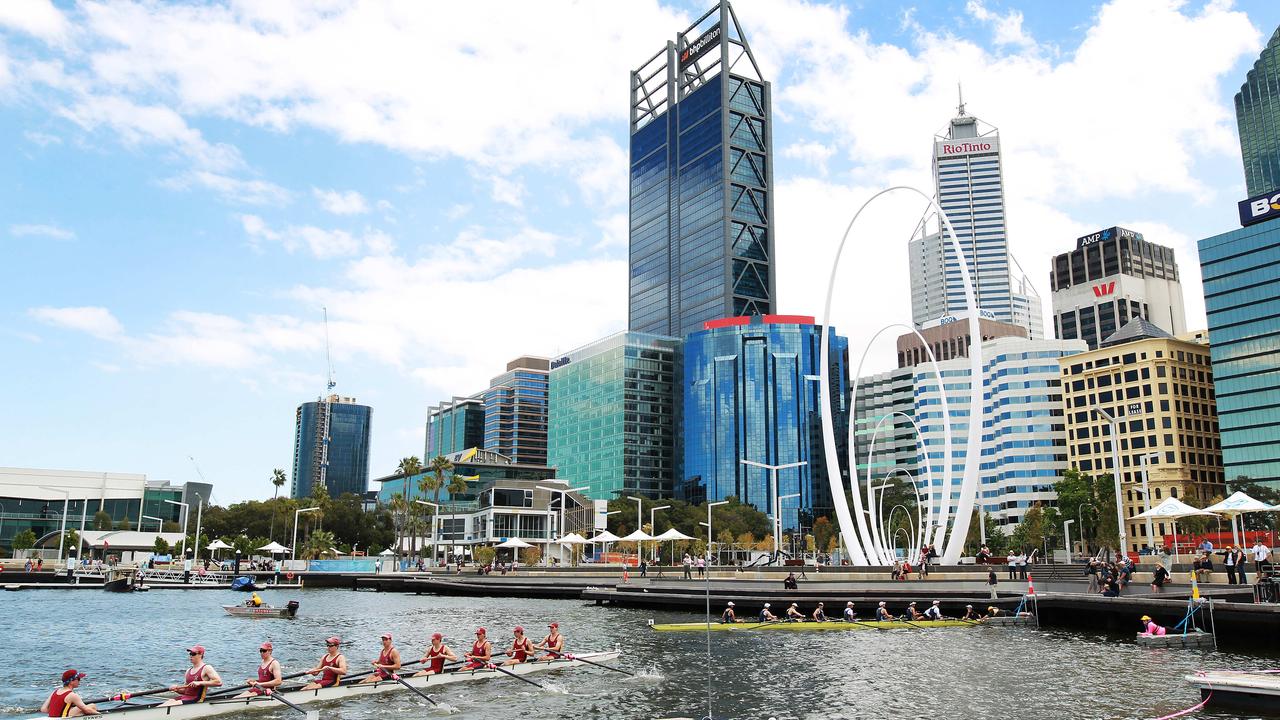
According to the HILDA report, wages have plummeted in Perth with the end of the mining boom.
The median income amount is the exact half way point in all incomes, with half earning more and half less. It differs from mean income which is the total income pool divided by the number of people working.
According to the Australian Bureau of Statistics the nationwide median income (before tax and super), including part-time as well as full-time workers, was $1019 a week or $52,988 a year. If you’re on a salary of $109,668 a year or more, well done, you’re in the top 10 per cent of all workers.
At the beginning of 2015, the median household income of people living in the Western Australian capital was nearing $60,000 while in every other capital city it was $50,000 or less.
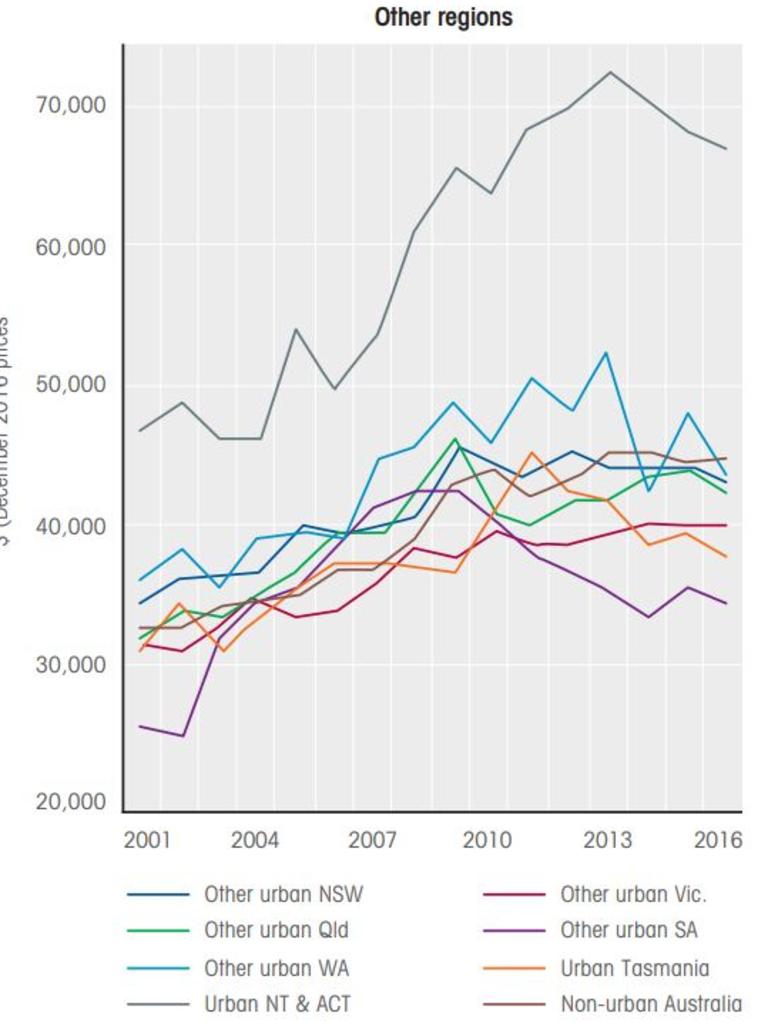
Between 2012 and 2016, incomes in Perth fell by -6.3 per cent. In urban areas of WA, excluding Perth, it was an even steeper drop with household income down by -10.5 per cent, the biggest fall in Australia.
“There has been considerable convergence of median incomes among the mainland capital cities between 2015 and 2016, due to a substantial decline in Perth and moderate increases in Sydney and Adelaide,” the report’s authors said.
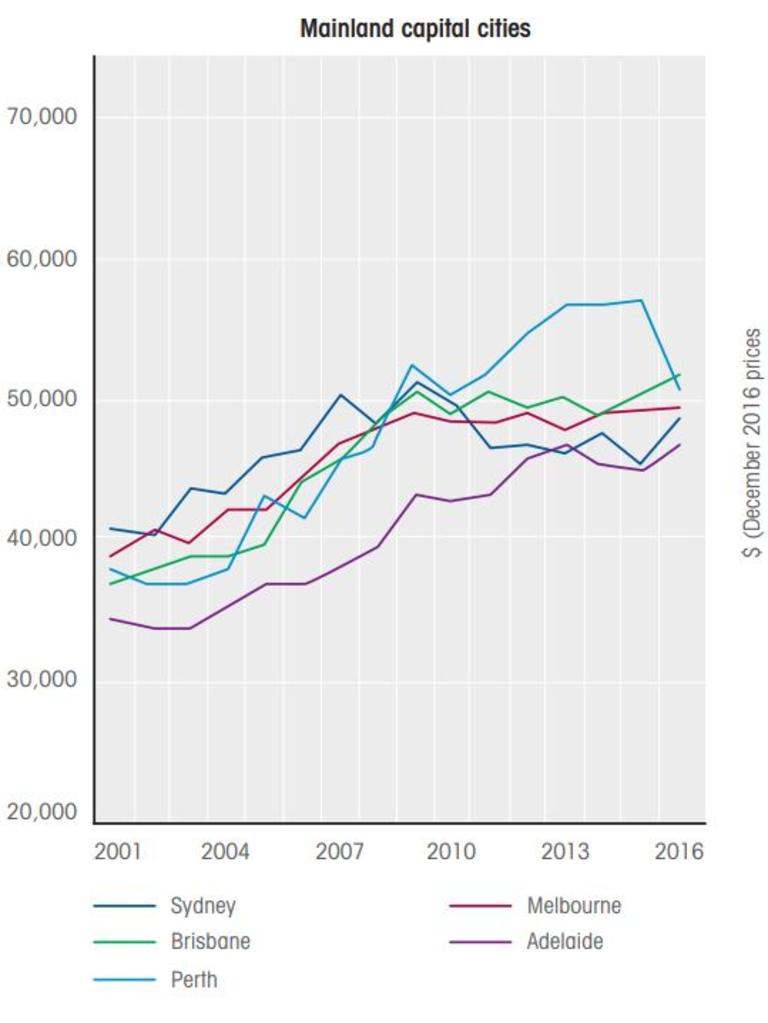
Perth was the only mainland state capital to see a wage downturn with families taking home on average $51,252 in 2016 versus $54,698 in 2012.
In Brisbane, wages went up from $49,637 in 2012 to $51,726 in 2016, a rise of 4.6 per cent.
But if you want to grab a share of Australia’s highest median wages you need to head to Canberra, or possibly Darwin. The research doesn’t differentiate between the two cities lumping them all into a category called “ACT and Urban NT”.
In this area, median household income is just over $67,000. But this is a -3.9 per cent fall from 2012.
The median income of Melbourne families is $49,359 while Sydneysiders are on $48,381. Despite median earnings being lower than Brisbane, Melbourne and Sydney could still have Australia’s highest individual income earners.
Adelaide residents are the laggards on $46,758, albeit a 1.8 per cent increase. The lowest income anywhere was in urban South Australia outside Adelaide where median earnings were $34,497.
The monthly State of the States report, compiled by CommSec and released last week, saw New South Wales knocked off the top spot by Victoria for the first time.
The analysis looked at a range of metrics to measure economic performance including earnings.
“Annual wage growth is historically low across capital cities. Wage growth in the year to March was strongest in both Victoria and Tasmania (2.3 per cent) ahead of Queensland (up by 2.2 per cent) while wages in Northern Territory were up only 1.1 per cent,” the report stated.
Western Australia recorded a month to month rise in earnings of 1.5 per cent.
Overall, Victoria edged out NSW due to strong population growth and broad construction activity, especially home building.
But the report said there was little to separate the two top states.
Queensland only managed a mediocre ranking when it came to economic performance.
“Queensland is now in fifth position on the performance rankings ahead of South Australia but there is little to separate the two economies. Queensland ranks fourth on two indicators and fifth on four indicators,” the report said.
Western Australia’s economy remains in the doldrums. It’s the worst performing state according to CommSec, dragged down by a weak job market and construction work 36.7 per cent below the decade average.
But there was some good news for the west with the report stating there were reasons to be optimistic about prospects for the WA economy: “Population growth is now the fastest in more than two years and equipment investment is at the highest levels in three years.”
In other areas, the HILDA report found the average expenditure on electricity and gas had fallen since it peaked in 2014, despite continued price rises.
Lead researcher Professor Roger Wilkins said the data suggested households had adapted to higher electricity and gas prices.
“People have found ways to reduce their energy consumption, for example buying energy-efficient appliances, installing solar panels, insulating their homes, LED lights and possibly also in winter heating fewer rooms in the house,” he said.
The latest available data from the survey showed mean expenditure on home energy had risen since 2006 — from $1727 a year (at December 2016 prices) to $2118 in 2015-2016. But it was higher, in real terms, in the 2013 to 2014 period, at $2185.
The research also found the peak age group for owning a driver’s licence was people aged between 35 to 44 years old, peaking at around 93 per cent for women and 96 per cent for men in this age range.
However, younger men were slowly losing the love for being behind the wheel.
Between 2012 and 2016, the proportion of men holding a licence declined from 71 per cent to 64.8 per cent for those aged 18 or 19, and from 90 per cent to 86.1 per cent for those aged 25 to 29.
RBA’s big call on 2024 rate cut
The RBA’s deputy governor Andrew Hauser has made a big call on the likelihood of a 2024 rate cut for Aussies.

Work pizza pic immediately sparks outrage
A simple picture posted online has exposed what people are beyond fed-up with at work, but bosses think they’re doing the right thing.

CEO slams ‘unrealistic’ 9-5 work expectation
The CEO of a global company has claimed the traditional 9-5 work model is ‘fading’, warning against strict return-to-office mandates.