
To buy or not to buy: Clues hidden in new housing price data
It would be easy to get excited and think now is the right time to jump into the housing market. This is why you need to be careful.

You might have heard rumours that the housing market is about to take off, that the price falls are finally over and that the time to buy is now.
It would be easy to get excited, grab your deposit and finally dive in. But is it still too soon? Be careful.
Because there are some tentative signs that in Sydney and Melbourne, house price falls are back. Earlier this year the fall in house prices was easing. But the newest data shows price falls seem to have intensified again at the end of April/start of May.
The next chart uses a daily home value index created by CoreLogic. As you can see, the speed at which house values are falling has varied. At one point values in Sydney were falling so fast that if it was maintained for a year, values would be down by 25 per cent. At other times they were falling at a rate equivalent to annual falls of just a few per cent.
RELATED: Falling house prices are bad news for your pay packet
RELATED: House prices notch worst annual fall since GFC
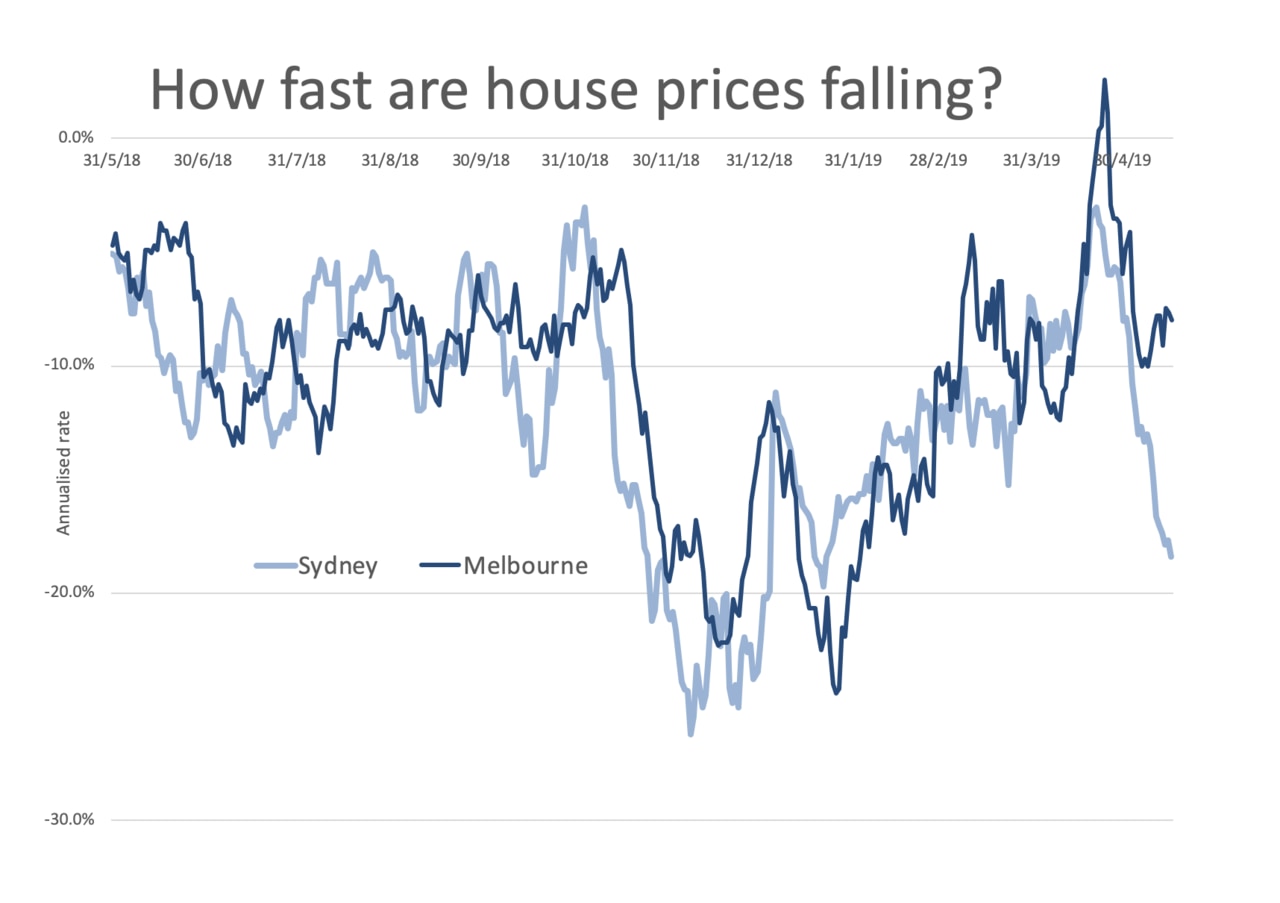
From New Year’s Day to near the end of April, the rate of falls seemed to decrease. The falls were getting slower and gentler. You can see the line rising steadily back towards zero. Values in Melbourne even seemed to rise again for a short while, as the dark blue line was above zero.
But around the end of April, something changed. Sydney’s falls seemed to accelerate. And Melbourne’s took a dive too.
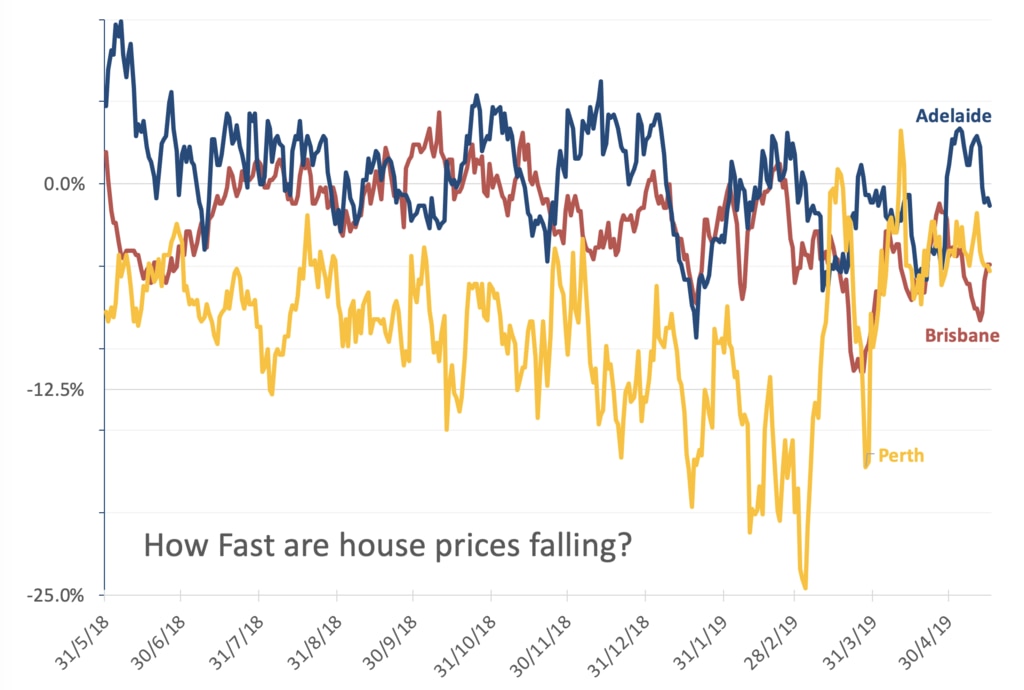
In Adelaide, Brisbane and Perth, the patterns are somewhat different. Perth’s values were falling hard until the end of February, before moderating. Adelaide house values are mostly stable and Brisbane actually seems to have had a small easing in the pace of price falls in the last few weeks.
It’s important to understand the CoreLogic daily data behind the above graphs. The index uses information on sale prices to infer values of all houses, including those that are not for sale. That means this index is an estimate of the value of all homes, not just those on the market. It is updated every day with not only data on sales prices but changes in the homes that exist, e.g. new built apartments or old homes demolished.
WHERE TO FOR HOUSING?
Data can tell us what has just happened but it can’t tell us what we really want to know about — the future. So will price falls continue or will the market recover? There are many moving pieces. One support for house prices is that the RBA is likely to cut interest rates. That should make mortgages cheaper and let people spend more on homes.
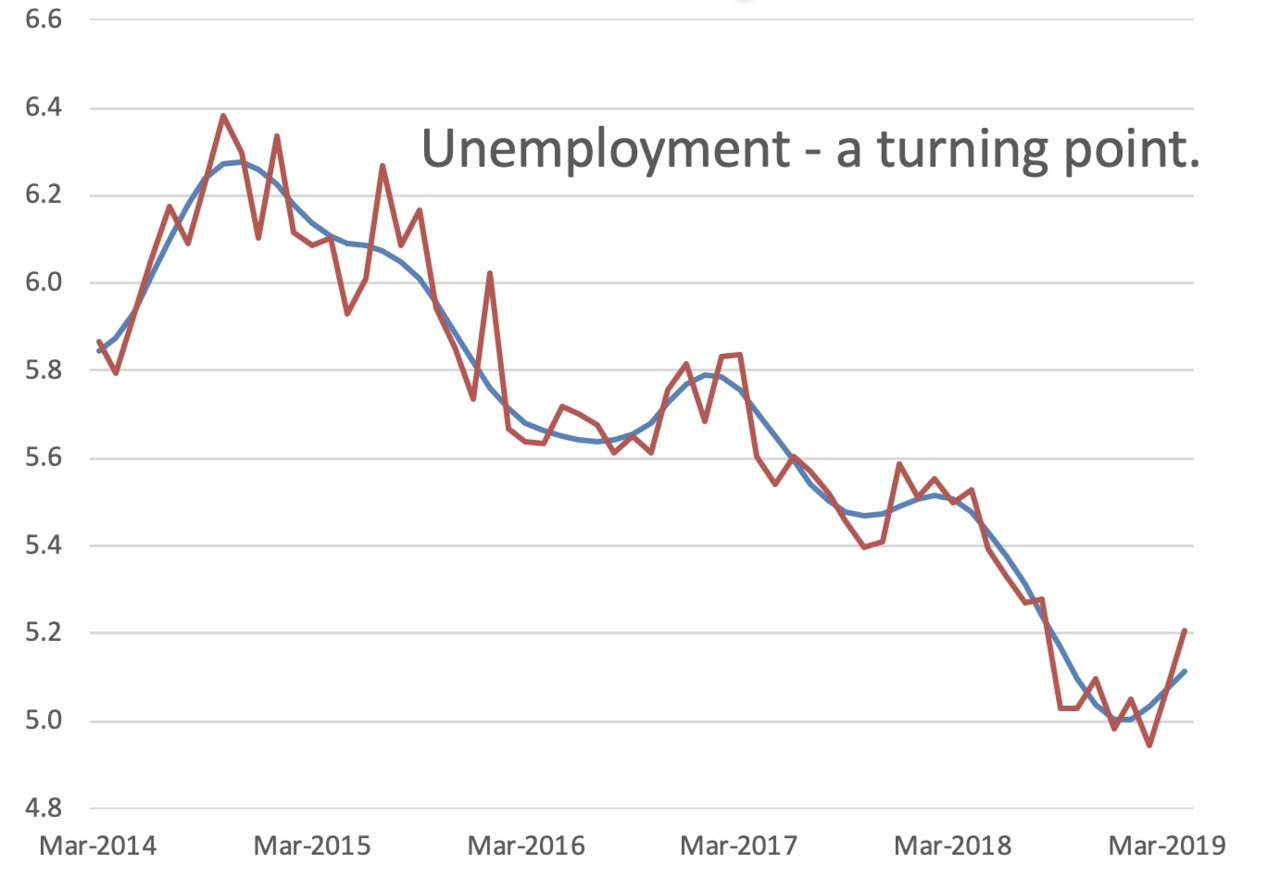
But look deeper. The reason the RBA would cut rates is because the economy is showing signs of weakness. On Thursday, the latest unemployment data came out and it showed a rise in unemployment, a rise in underemployment, and the mix of jobs shifting from full time to part time.
With record high household debt, weak wages growth and now also a rising unemployment rate, it is hard to see how much enthusiasm there will be for spending up big on property.
The other big factor affecting housing prices is policy. Labor has promised to make two policy changes — to negative gearing and capital gains tax — that could both affect the property market.
Their goal is to make housing more affordable. If Labor wins the election, their new policies will start on 1 January 2020. That could cause some people to try to rush into property before the changes take effect early next year, creating the appearance of a strong market before gravity takes hold again.
The effect of these policy changes is not likely to be big overall, but it could affect certain types of property. Labor will end negative gearing only on existing properties. That is likely to reduce investor demand for those properties and increase investor demand for new homes. With less competition for those kind of properties, prices in that category could fall, and more existing homes could end up in the hands of owner occupiers.
It’s a fascinating time to be watching the housing market. Anything could happen. If you’re buying or selling, you need to pay attention — as the graphs above show, trends in the market can change very, very quickly.
Jason Murphy is an economist. He writes the blog Thomas the Think Engine.
Continue the conversation @jasemurphy

‘Egg on their face’: Number that will shock RBA
The RBA’s decision to hold interest rates could backfire spectacularly when crucial quarterly inflation figures are released.

Huge profits as 20-year home move expires
Homeowners are cashing in big time after a 20-year-old market trend has come to an end.

Snow in Qld? 15 homes that are turning up the heat
Queensland may be better known for its swimming pools than its fireplaces, but with snow on the horizon - yes, snow - the owners of these homes might just have the last laugh.