Australian house prices: Top-performing suburbs in every state that have defied the downturn
Home prices in some Aussie suburbs are growing by as much as 43 per cent year-on-year. This is where.
Australia’s housing market has had a mixed start to spring, but PropTrack data has revealed a number of suburbs around the country that have seen massive growth over the past 12 months.
Looking at markets with at least 100 sales for the year, the data revealed some had experienced boom like growth cycles.
The Perth suburb of Armadale was the best performer, with 42.9 per cent growth in house values year on year.
Davoren Park was Adelaide’s best with nearly 38 per cent growth, while Sydney’s Gables (33 per cent) and Brisbane’s Kingston (29.2 per cent) topped their states. Victoria was more subdued than the other states, with Ivanhoe (17.3 per cent) leading the way.
RELATED: Apartment approvals plummet to nearly GFC levels
‘Sexy, moody’: Nude Bromley mural found in Melbourne home
Negative gearing changes would ‘throw gasoline on the fire’
PropTrack senior economist Eleanor Creagh said several factors were contributing to robust performance in these areas, such as tight supply, migratory trends to more affordable areas and lower base prices attracting buyers. Rising interest rates had also sparked more competition for affordable ends of the market.

Ms Creagh said nation wide that the key issue was the controlled building activity alongside strong population growth has led to a chronic shortage of housing in both rental and buying markets.
“Addressing the supply of suitable homes across the country is of paramount importance,” she said.
New South Wales
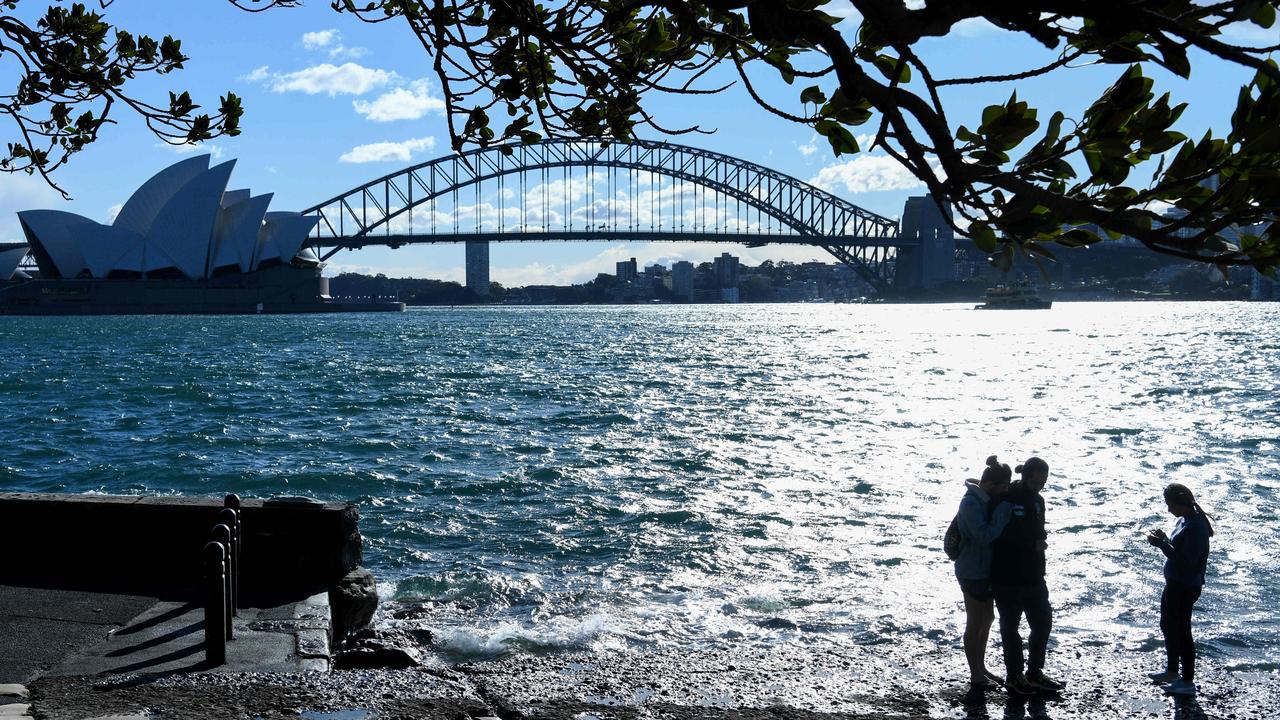
Sydney has defied affordability challenges due to home equity gains and persistent growth motivating buyers.
Leading housing growth in NSW over the last 12 months was Gables (33 per cent), Lismore (23.1 per cent) and Chester Hill (22.4 per cent).
Lindfield (33.7 per cent), Queanbeyan East (23.4 per cent) and Elizabeth Bay (20.2 per cent), led unit growth.
Ms Creagh said the city’s market remains robust, though further insights into Sydney’s future performance remain to be seen.
McGrath Northwest – Kellyville’s Wayne Zhara said the masterplan suburb of Gables has done so well in the last 12 months due to it being set up as the perfect family residential suburb
“It’s sets a new standard of what suburb planning should look like – it has amazing infrastructure coming and it has been set up as a family residential suburb – it’s still very close to amenities outside of Gables, that is what the buzz is in the town.
“4000 dwellings we’re about 50 per cent of the way through, Santa Sophia Catholic College has been a draw card and a lot of young families want their children to be part of that school – the suburb is bringing back the old days, it’s a safe community.
“It’s paramount when planning suburbs the planners get it right, the buyer needs to see the lifestyle opportunity.
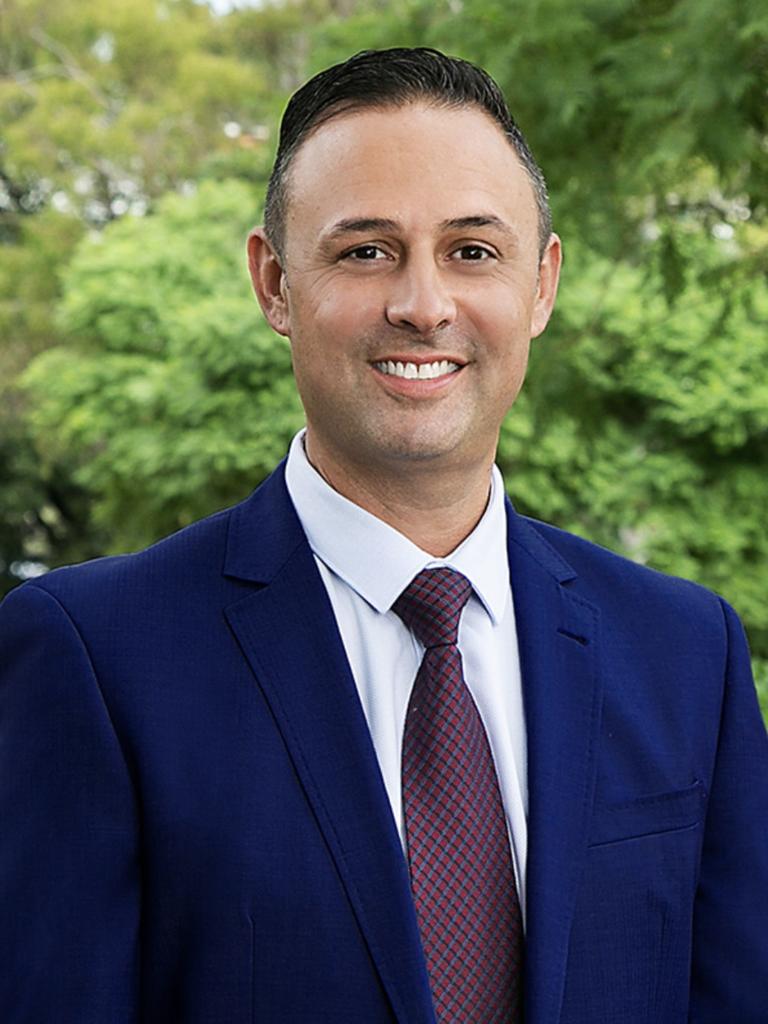
Mr Zhara said the market is Sydney more broadly was strong but it is harder to sell than it was previously.
“Buyers still want to transact but it’s all about the bottom line with restrictions that they’ve had with lending capabilities and with the overall standard costs of living it has stressed buyers to the fullest,” he said.
“Buyers decisions aren’t being made as quickly as they would have done in the past – they’re considering am I going to spend $2m today, or am I going to understand what I’m getting beyond the house – that’s why Gables is so great.”
Top 10 House Growth Suburbs in last year
Suburb | Region | Number Sold 12 months | Median Sale Price 12 months | Change in Median Price 12 months |
| Gables | Sydney - Baulkham Hills and Hawkesbury | 138 | $1,450,000 | 33 |
| Lismore | Richmond - Tweed | 109 | $400,000 | 23.1 |
| Chester Hill | Sydney - Parramatta | 122 | $1,200,000 | 22.4 |
| South Lismore | Richmond - Tweed | 106 | $287,500 | 22.3 |
| Punchbowl | Sydney - Inner South West | 126 | $1,290,500 | 21.7 |
| Earlwood | Sydney - Inner South West | 154 | $2,102,500 | 20.6 |
| Kingsgrove | Sydney - Inner South West | 109 | $1,850,000 | 20.5 |
| Kingsgrove | Sydney - Inner South West | 109 | $1,850,000 | 20.5 |
| Bossley Park | Sydney - South West | 111 | $1,250,000 | 19 |
| Rosemeadow | Sydney - Outer South West | 110 | $875,000 | 19 |
| Auburn | Sydney - Parramatta | 171 | $1,300,000 | 18.2 |
| The Ponds | Sydney - Blacktown | 200 | $1,650,000 | 17.9 |
Top 10 Unit Growth Suburbs in last year
Suburb | Region | Number Sold 12 months | Median Sale Price 12 months | Change in Median Price 12 months |
| Lindfield | Sydney - North Sydney and Hornsby | 109 | $1,380,000 | 33.7 |
| Queanbeyan East | Capital Region | 102 | $475,000 | 23.4 |
| Elizabeth Bay | Sydney - City and Inner South | 173 | $1,100,000 | 20.2 |
| Cammeray | Sydney - North Sydney and Hornsby | 147 | $1,376,000 | 18.1 |
| Bellevue Hill | Sydney - Eastern Suburbs | 141 | $1,600,000 | 17.6 |
| Killara | Sydney - North Sydney and Hornsby | 101 | $1,200,000 | 17.4 |
| Banora Point | Richmond - Tweed | 145 | $735,000 | 14.8 |
| Marrickville | Sydney - City and Inner South | 191 | $900,000 | 14.6 |
| Dulwich Hill | Sydney - City and Inner South | 205 | $923,000 | 13.3 |
| Freshwater | Sydney - Northern Beaches | 113 | $1,122,000 | 12.2 |
Victoria
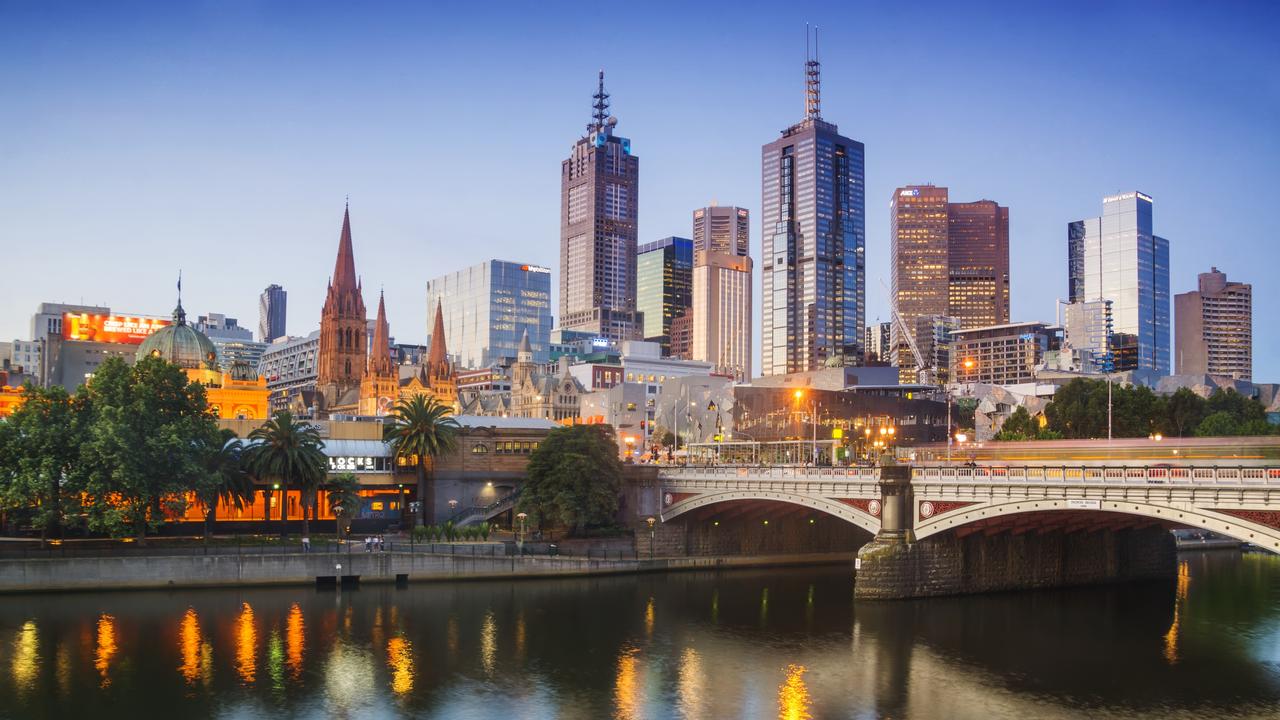
Melbourne’s market has faced unique challenges, including unfavourable investment taxation and changes to tenancy laws making investment properties less attractive.
Leading house price growth over the last 12 months was Ivanhoe (17.3 per cent), Diamond Creek (13.2 per cent) and Coburg North (12.8 per cent).
Blackburn (22.1 per cent), Box Hill (11.1 per cent) and Surrey Hills (11 per cent), led unit growth.
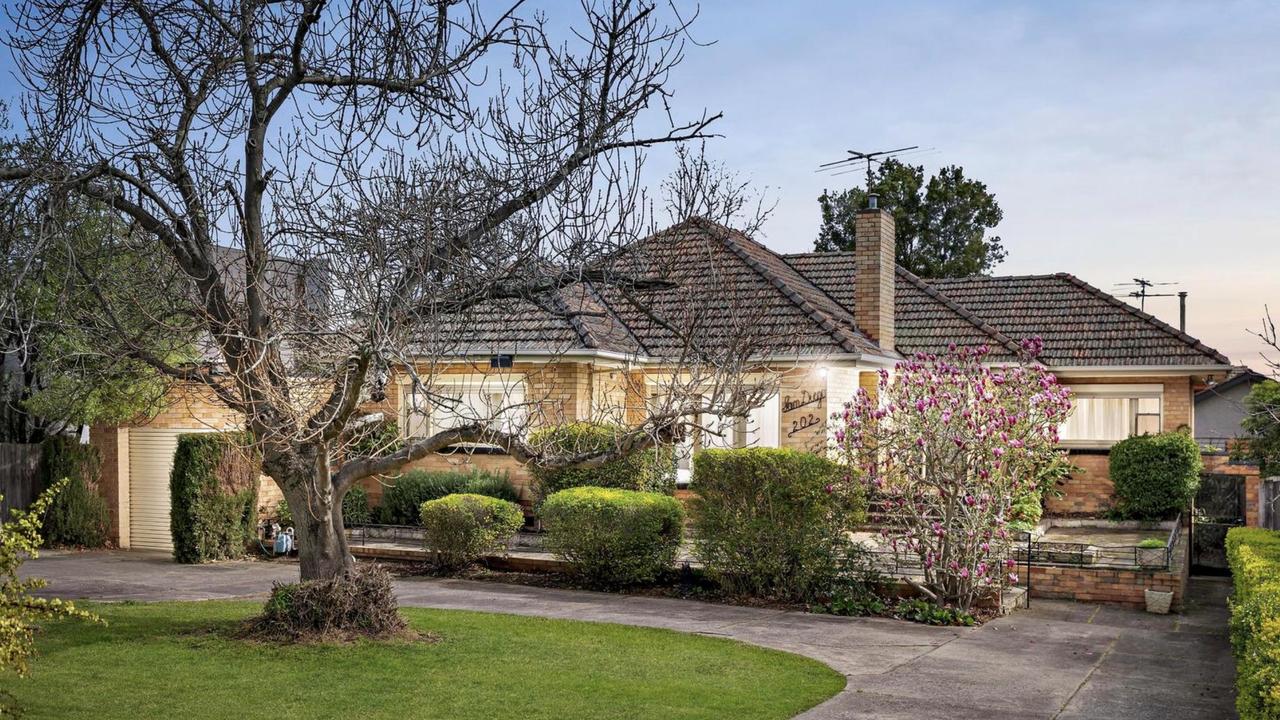
Ms Creagh there had been more sales than purchases by investors in Melbourne, although buyers benefit from increased choices with the highest total listings since 2018.
“The market has not fully recovered from the pandemic downturn,” she said.
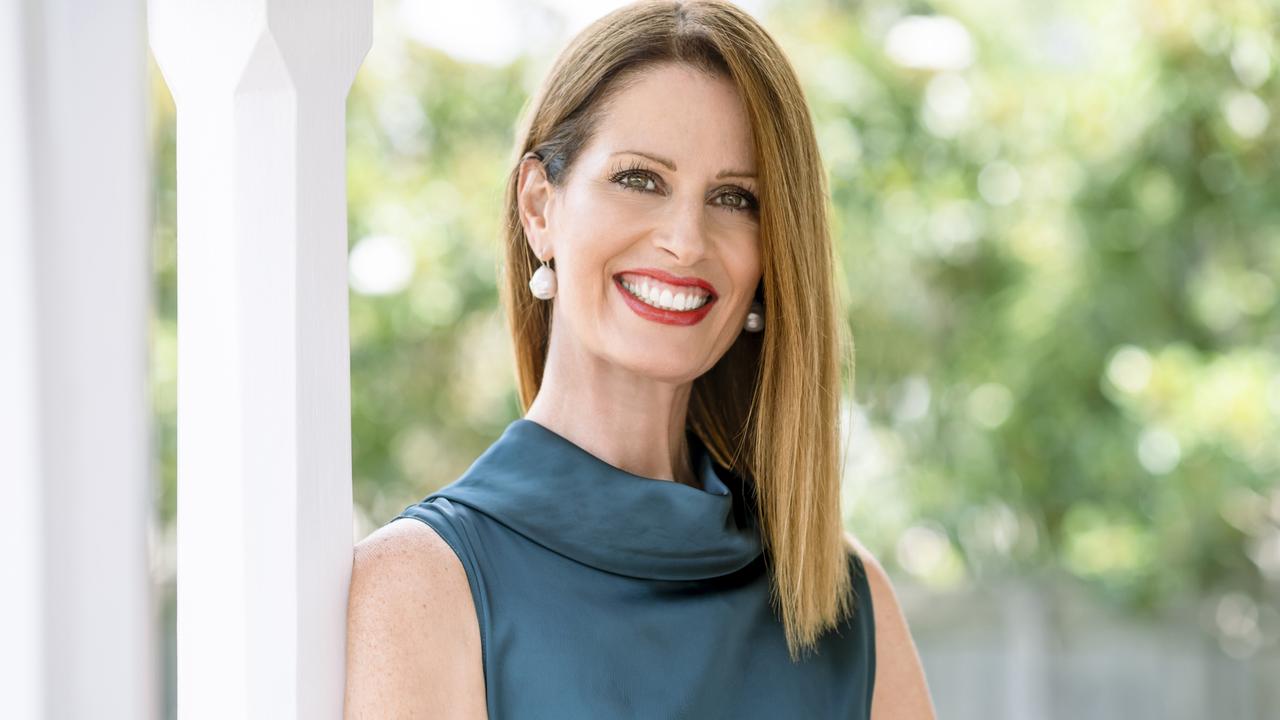
Prominent Melbourne buyers advocate Cate Bakos said Diamond Creek and Coburg North are catering to first home buyers as they offer great amenities.
“Ivanhoe’s surge of activity could be to do with mortgage stress,” Ms Bakos said.

“With higher interest rates, we’ve seen sales at higher price points and a higher turnover in the top quartile.
“With units, Blackburn, Box Hill, and Surrey Hills have all seen significant overseas interest, especially since the Covid lockdowns – skilled migrants have been arriving in these areas and the hospital precinct.“
Top 10 House Growth Suburbs in last year
Suburb | Region | Number Sold 12 months | Median Sale Price 12 months | Change in Median Price 12 months |
| Ivanhoe | Melbourne - North East | 104 | $1,700,500 | 17.3 |
| Diamond Creek | Melbourne - North East | 149 | $1,075,000 | 13.2 |
| Coburg North | Melbourne - North West | 108 | $1,012,500 | 12.8 |
| Parkdale | Melbourne - Inner South | 124 | $1,517,500 | 12.4 |
| Ringwood North | Melbourne - Outer East | 123 | $1,250,000 | 11.6 |
| Bendigo | Bendigo | 110 | $600,000 | 11.4 |
| Newtown | Geelong | 114 | $1,241,250 | 10.8 |
| Hallam | Melbourne - South East | 123 | $740,000 | 10.4 |
| Greensborough | Melbourne - North East | 205 | $1,050,000 | 9.4 |
| Eltham | Melbourne - North East | 189 | $1,310,000 | 9.2 |
Top 10 Unit Growth Suburbs in last year
Suburb | Region | Number Sold 12 months | Median Sale Price 12 months | Change in Median Price 12 months |
| Blackburn | Melbourne - Inner East | 163 | $750,000 | 22.1 |
| Box Hill | Melbourne - Inner East | 352 | $596,500 | 11.1 |
| Surrey Hills | Melbourne - Inner East | 116 | $938,000 | 11 |
| Cheltenham | Melbourne - Inner South | 242 | $672,500 | 10.1 |
| Port Melbourne | Melbourne - Inner | 247 | $755,000 | 10.1 |
| Chadstone | Melbourne - South East | 111 | $930,000 | 9.4 |
| Northcote | Melbourne - Inner | 231 | $640,000 | 8.8 |
| Melbourne | Melbourne - Inner | 2178 | $575,250 | 8.5 |
| Murrumbeena | Melbourne - Inner South | 132 | $571,500 | 8.3 |
| Caulfield North | Melbourne - Inner South | 226 | $647,500 | 7.7 |
Queensland
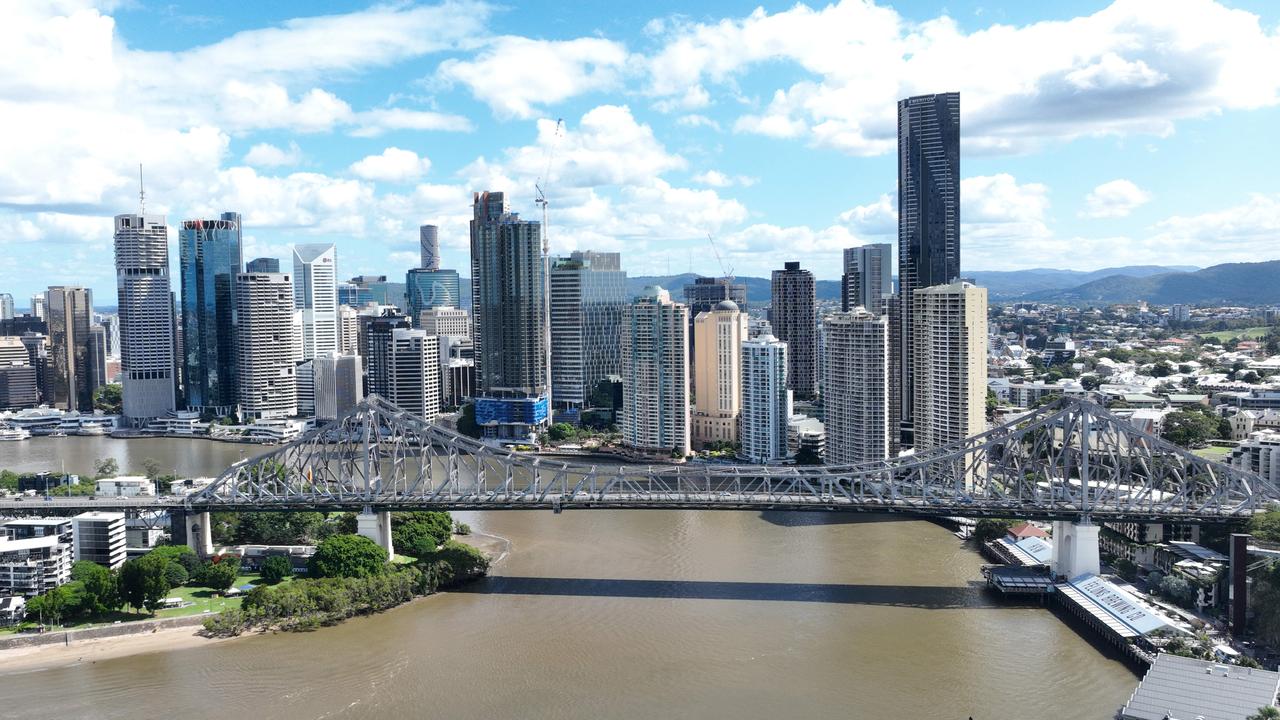
Queensland continues to experience strong growth, driven by affordability in regions like Logan, Beaudesert, and Ipswich.
Ms Creagh said these affordable areas were recording significant growth, pushing buyers down the value chain.
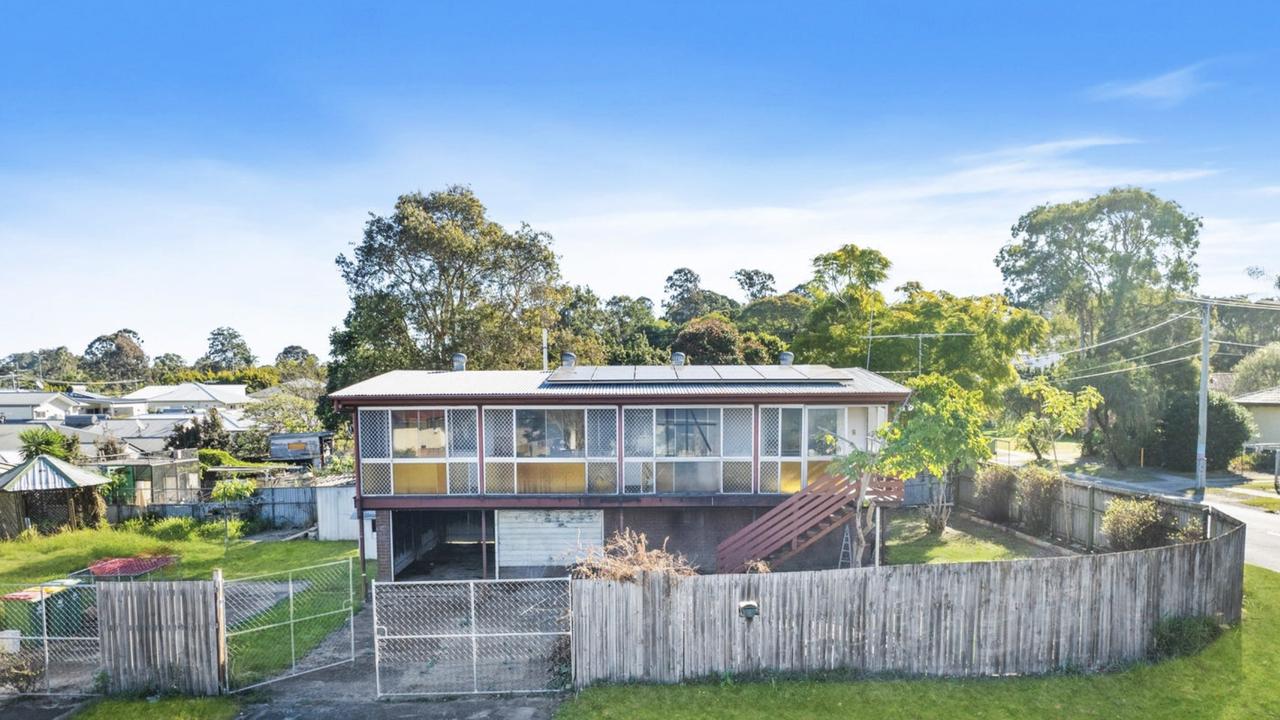
The state’s top performers for houses over 12 months were Kingston (29.2 per cent), Calamvale (26.2 per cent) and Koongal (26 per cent).
For units, it was Annerley (31.3 per cent), Woodridge (29.4 per cent) and Main Beach (28.3 per cent).

NGU Real Estate’s Jason Yang said many riverfront homes were currently on the market in Brisbane, with an attractive feature being the connection to the Cross River Rail project via the train line. “This connectivity has made Yeerongpilly a desirable location, prompting buyers to pay a premium to remain close to Brisbane CBD — a feature that differentiates it from suburbs like Westlake and Mount Ommaney,” Mr Yang said.
“The recent addition of train lines and stations in Queensland is considered a safe investment, contributing positively to the real estate market.”
Mr Yang emphasised that land in South East Queensland remains highly valuable, especially in suburbs with older homes and generational wealth, which continue to flourish.
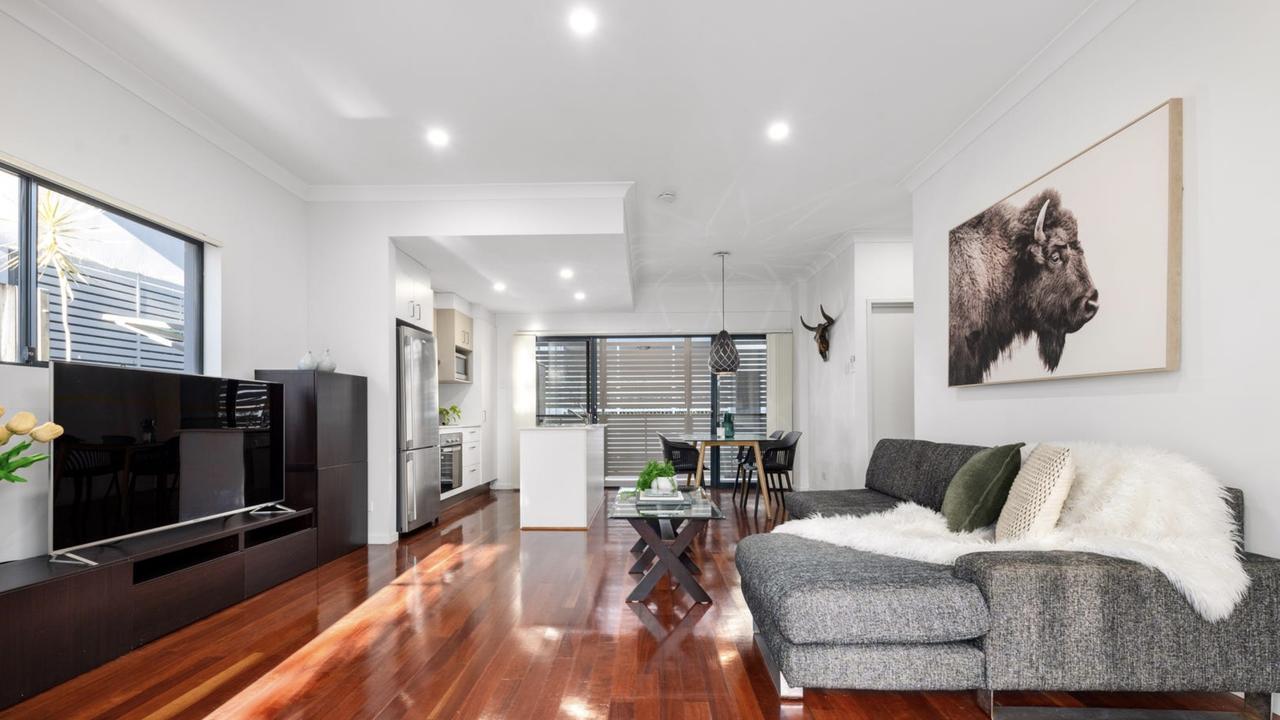
“In today’s market, the cost to replace these homes would be prohibitive – from an investment perspective, negative gearing benefits are substantial,” he said.
“If investors navigate this correctly, considering the current rental crisis, appropriate policies could address these shortages effectively.
“One of the significant financial hurdles in purchasing a home is the stamp duty,”
Mr Yang believes that implementing the right exemptions at the correct thresholds for families entering the market could make a notable difference, potentially easing the transition for new buyers.
Top 10 House Growth Suburbs in last year
Suburb | Region | Number Sold 12 months | Median Sale Price 12 months | Change in Median Price 12 months |
| Kingston | Logan - Beaudesert | 141 | $620,000 | 29.2 |
| Calamvale | Brisbane - South | 111 | $1,210,000 | 26.2 |
| Koongal | Central Queensland | 103 | $387,500 | 26 |
| Leichhardt | Ipswich | 103 | $535,000 | 25.9 |
| Goodna | Ipswich | 154 | $572,500 | 25.8 |
| North Mackay | Mackay - Isaac - Whitsunday | 134 | $440,000 | 25.7 |
| Woodridge | Logan - Beaudesert | 153 | $600,000 | 25.5 |
| Marsden | Logan - Beaudesert | 154 | $688,000 | 23.9 |
| Flinders View | Ipswich | 101 | $685,000 | 23.4 |
| Bargara | Wide Bay | 198 | $800,000 | 23.1 |
Top 10 Unit Growth Suburbs in last year
Suburb | Region | Number Sold 12 months | Median Sale Price 12 months | Change in Median Price 12 months |
| Annerley | Brisbane - South | 142 | $650,000 | 31.3 |
| Woodridge | Logan - Beaudesert | 196 | $330,000 | 29.4 |
| Main Beach | Gold Coast | 178 | $1,585,000 | 28.3 |
| Beenleigh | Logan - Beaudesert | 110 | $369,300 | 25.8 |
| Zillmere | Brisbane - North | 119 | $530,000 | 24.7 |
| Runaway Bay | Gold Coast | 129 | $860,000 | 23.4 |
| Eagleby | Logan - Beaudesert | 139 | $411,500 | 22.8 |
| Lutwyche | Brisbane Inner City | 163 | $620,000 | 22.5 |
| Richlands | Ipswich | 163 | $530,005 | 22.2 |
| Albion | Brisbane Inner City | 135 | $610,000 | 22 |
South Australia
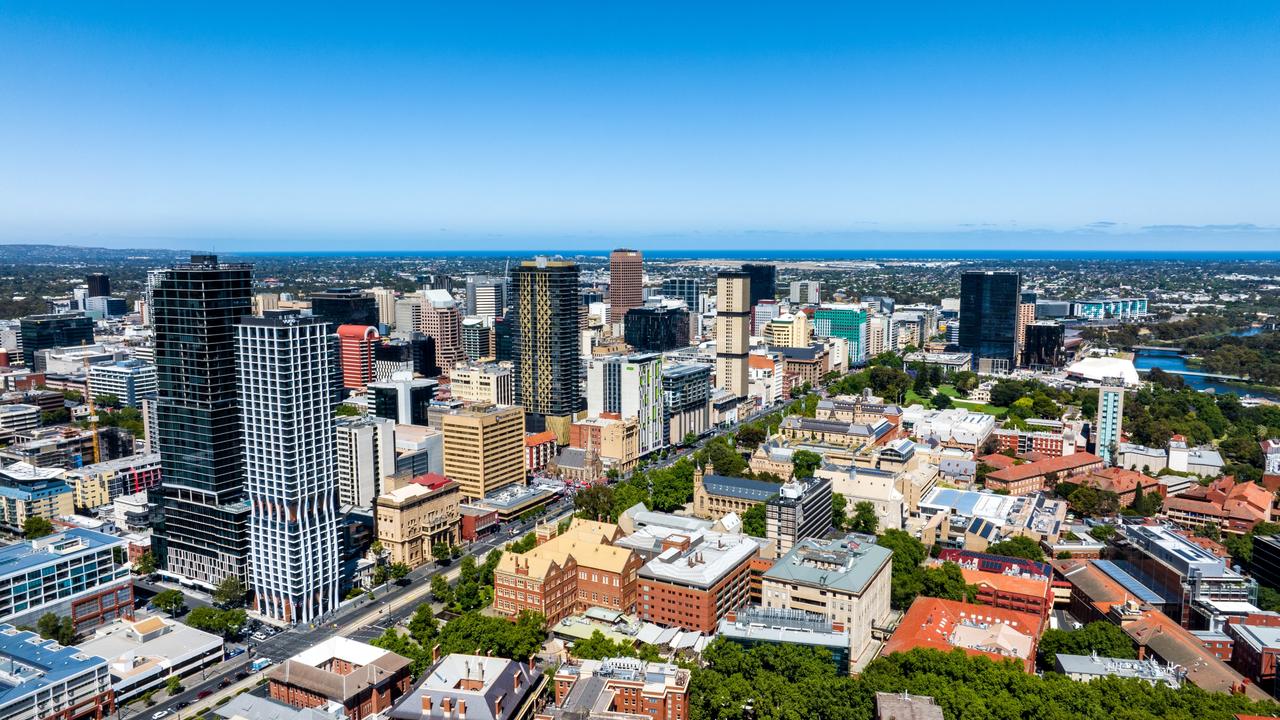
Adelaide has seen significant growth in recent years, particularly during the pandemic.
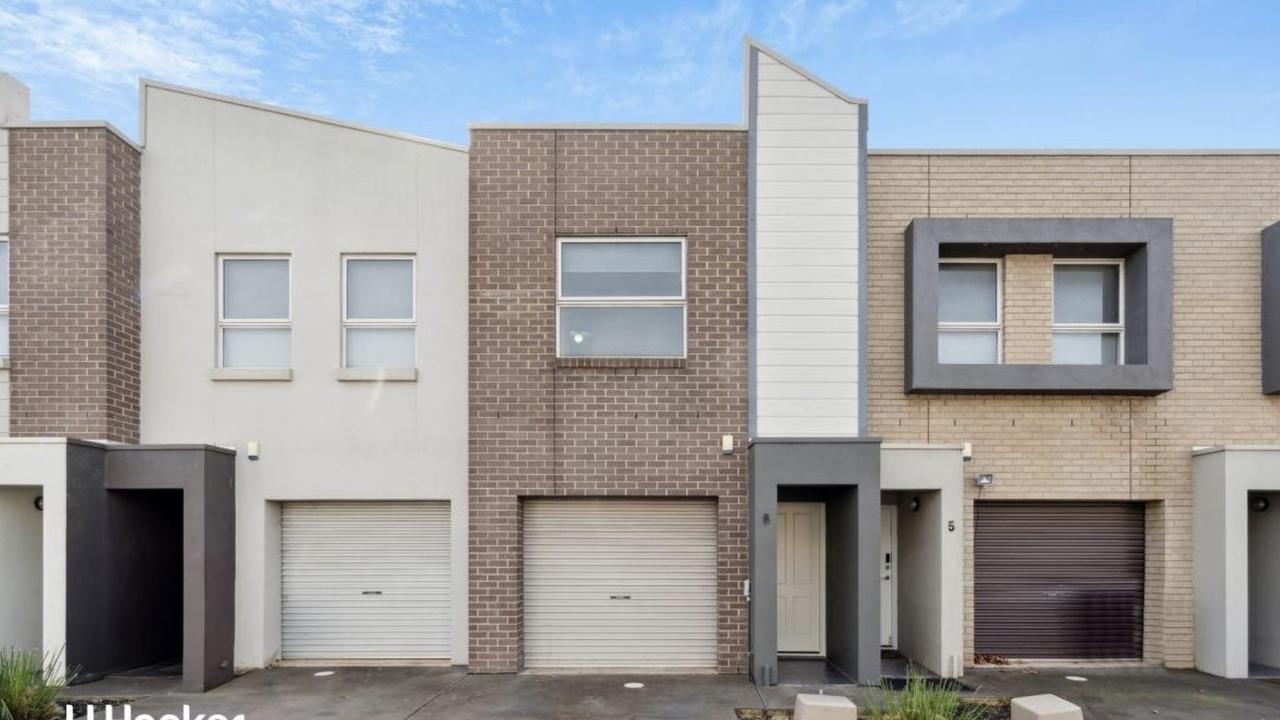
Leading the way over the last 12 months were Davoren Park (37.9 per cent), Munno Para (33.7 per cent) and Elizabeth North (31.3 per cent) for houses.
Meanwhile, Mawson Lakes (46.7 per cent) and Mount Gambier (48.8 per cent), led unit growth.
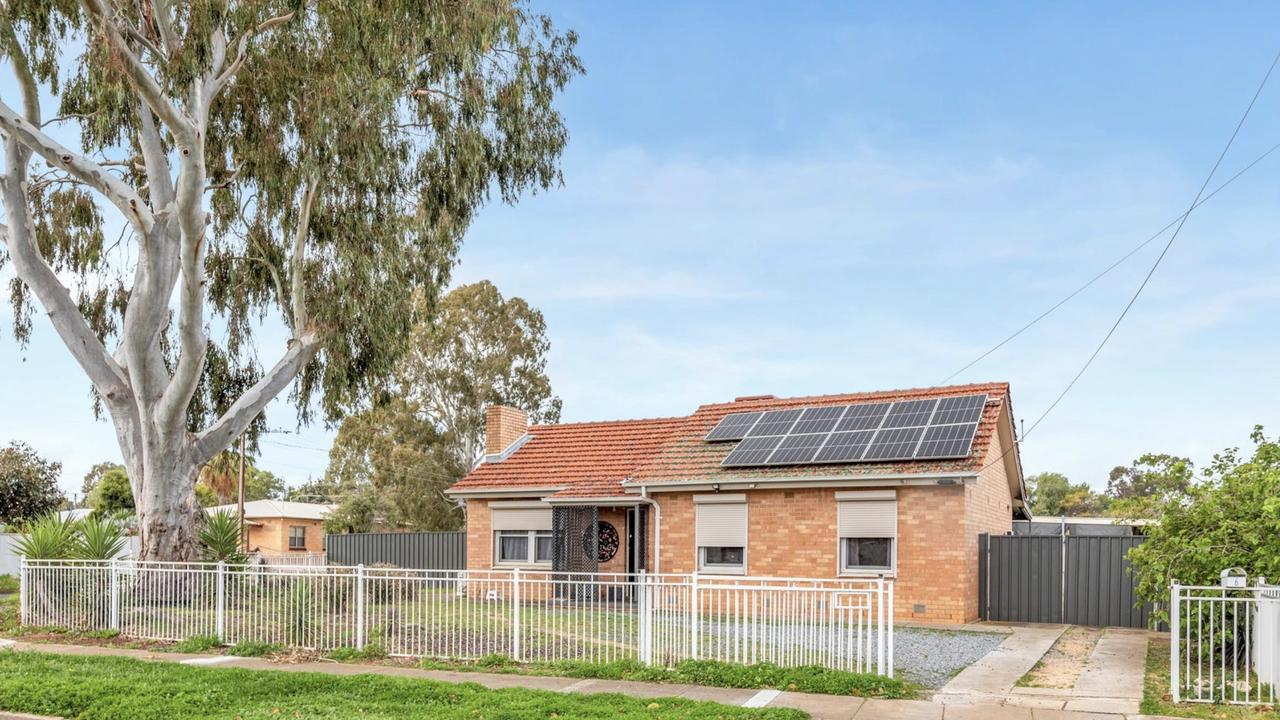
“South Australia has experienced notable affordability deterioration, with regions in Adelaide’s North outperforming due to investment and infrastructure developments,” Ms Creagh said.
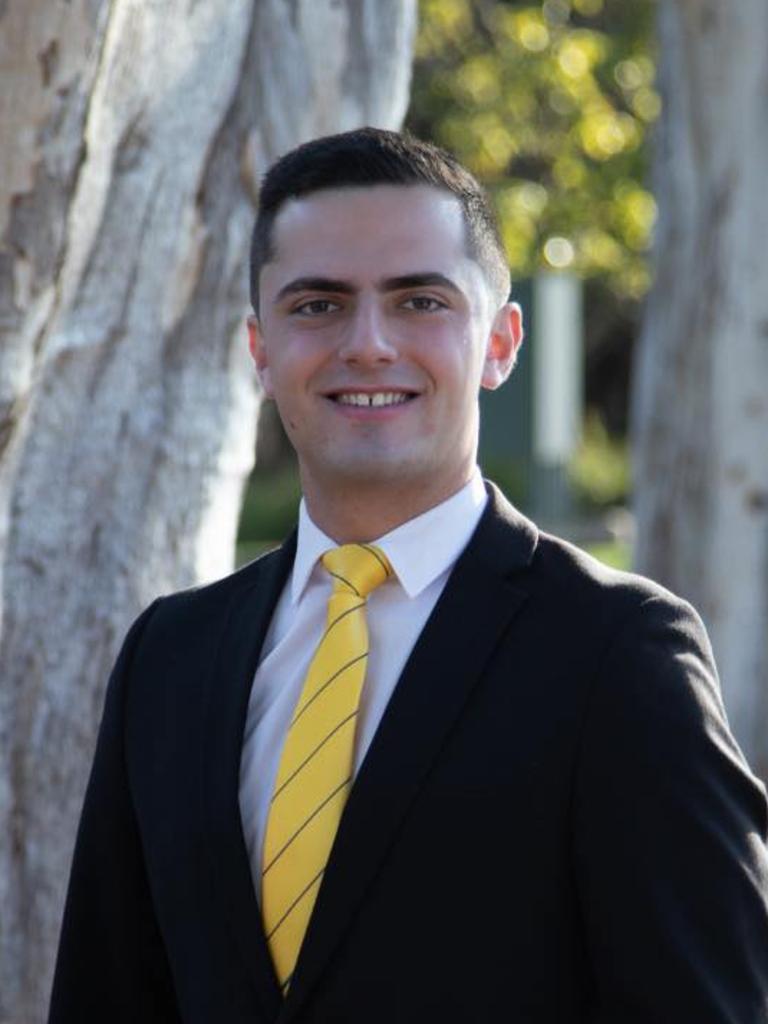
Ray White Craigmore’s Anthony Cirillo said a lot of interest from first home buyers were pushing up prices in Adelaide’s northern suburbs.
“Davoren Park was one of the most affordable suburbs in Adelaide – buyers can find a home for under $500,000 here.
“Owner occupiers make up the market in South Australia and a lot of local investors – there isn’t enough of supply of affordable homes.
“We need to see a policy shift from the federal and state governments allowing it to be easier to build and cap migration for a little bit.”
Mr Cirillo said the property market in Adelaide is like a game of musical chairs.
“Some people were panic buying like toilet paper at one stage and was snapping up anything they could find – I think that’s contributed to the situation we’re in right now,” he said.
Top 10 House Growth Suburbs in last year
Suburb | Region | Number Sold 12 months | Median Sale Price 12 months | Change in Median Price 12 months |
| Davoren Park | Adelaide - North | 226 | $455,000 | 37.9 |
| Munno Para | Adelaide - North | 144 | $522,075 | 33.7 |
| Elizabeth North | Adelaide - North | 111 | $420,000 | 31.3 |
| Elizabeth Park | Adelaide - North | 121 | $487,750 | 28.4 |
| Elizabeth East | Adelaide - North | 103 | $492,000 | 27.1 |
| Smithfield Plains | Adelaide - North | 102 | $465,500 | 25.8 |
| Elizabeth Downs | Adelaide - North | 142 | $451,500 | 25.4 |
| Salisbury North | Adelaide - North | 175 | $515,000 | 24.8 |
| Andrews Farm | Adelaide - North | 213 | $535,000 | 24.4 |
| Paralowie | Adelaide - North | 240 | $607,500 | 22.7 |
Top Unit Growth Suburbs in last year
Suburb | Region | Number Sold 12 months | Median Sale Price 12 months | Change in Median Price 12 months |
| Mawson Lakes | Adelaide - North | 153 | $440,000 | 46.7 |
| Mount Gambier | South Australia - South East | 105 | $305,000 | 48.8 |
Western Australia
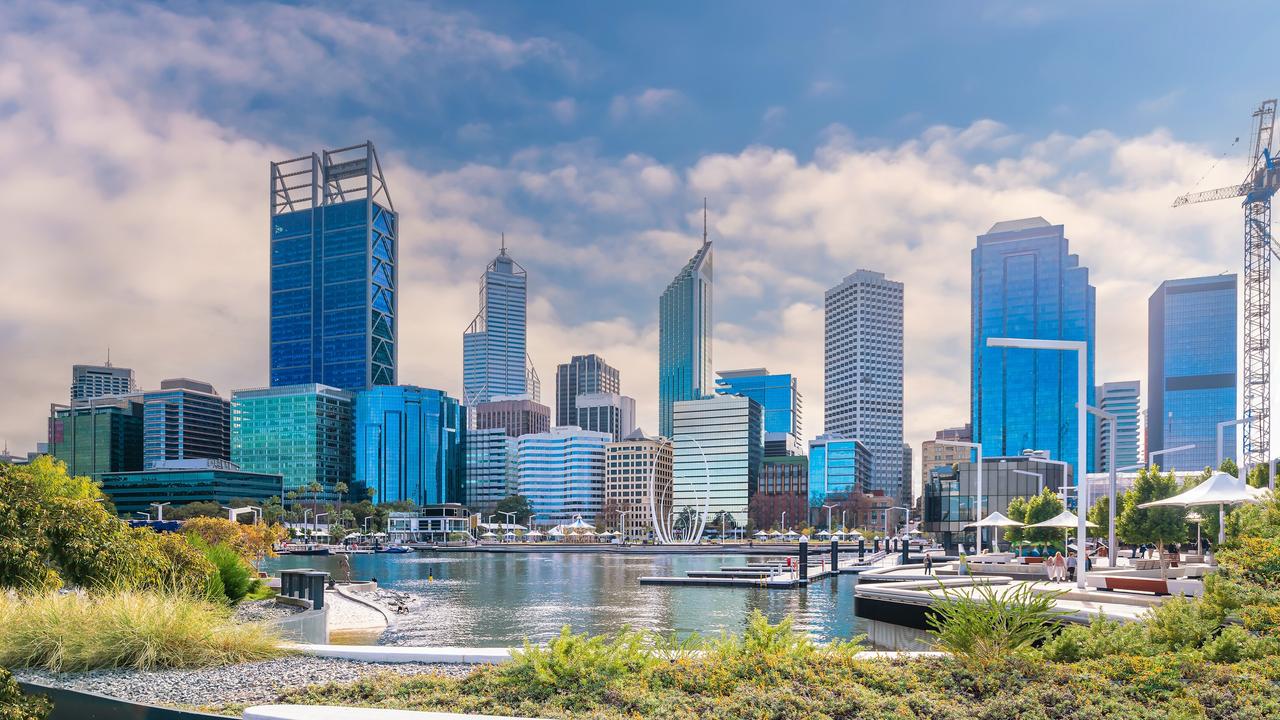
Perth has been the nation’s strongest performing market over the past year.
Armadale had the most growth for houses (42.9 per cent), followed by Camillo (41.7 per cent) and Parmelia (39.7 per cent).
Gosnells (38.9 per cent), Armadale (33.2 per cent) and Rockingham (28.9 per cent), led unit growth.
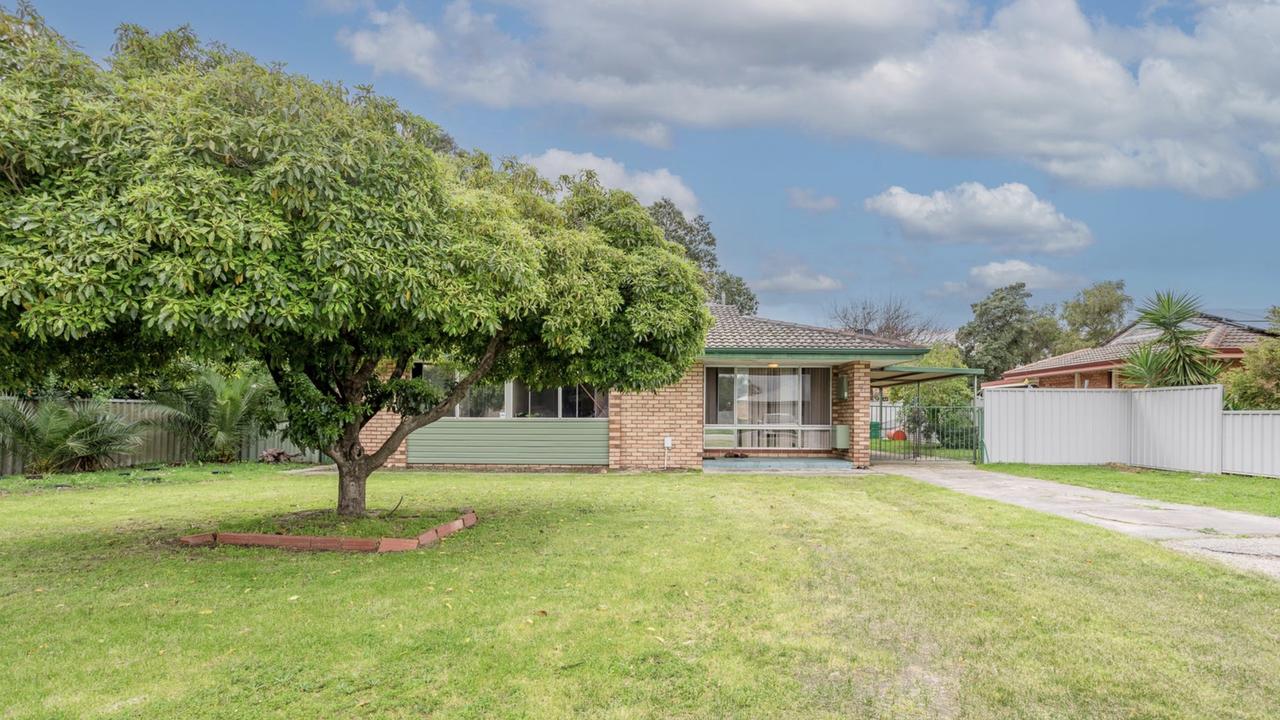
Ms Creagh said WA prices have surged by more than 23 per cent over the past year, driven by relative affordability and constrained supply leading to competitive conditions.
“The rental market fosters investor activity, encouraging prompt purchases,” Ms Creagh said.
Perth’s recent growth follows years of economic stagnation and can be seen as catching up after a period of underperformance.
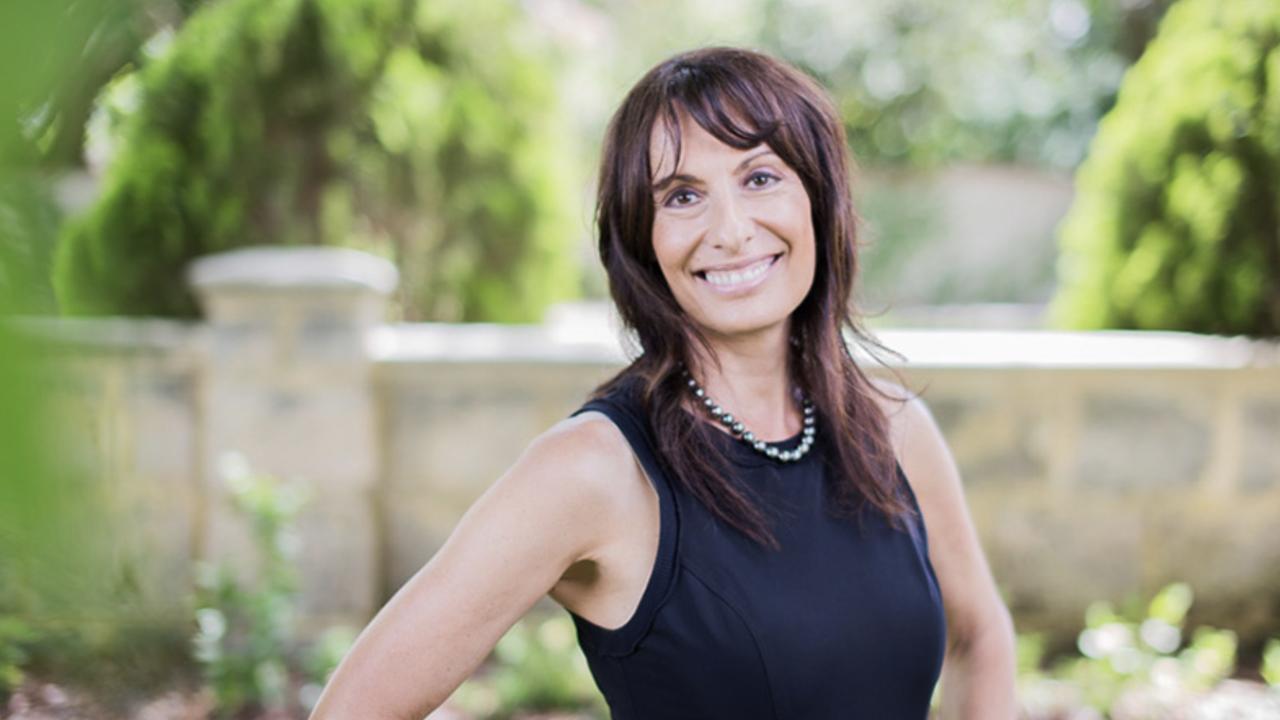
EQ Realty managing director Erit David from Perth said that population growth and rental availability in cities like Sydney and Melbourne are shaping the property trends in Perth.
“Inner-city areas have become unaffordable for first-time home buyers, pushing them towards developing areas like Armadale, Camillo, and Parmelia,” Ms David said.
“Population inflow, particularly of young professionals thriving on high salaries, is influencing Perth’s demographic and geographic landscape.
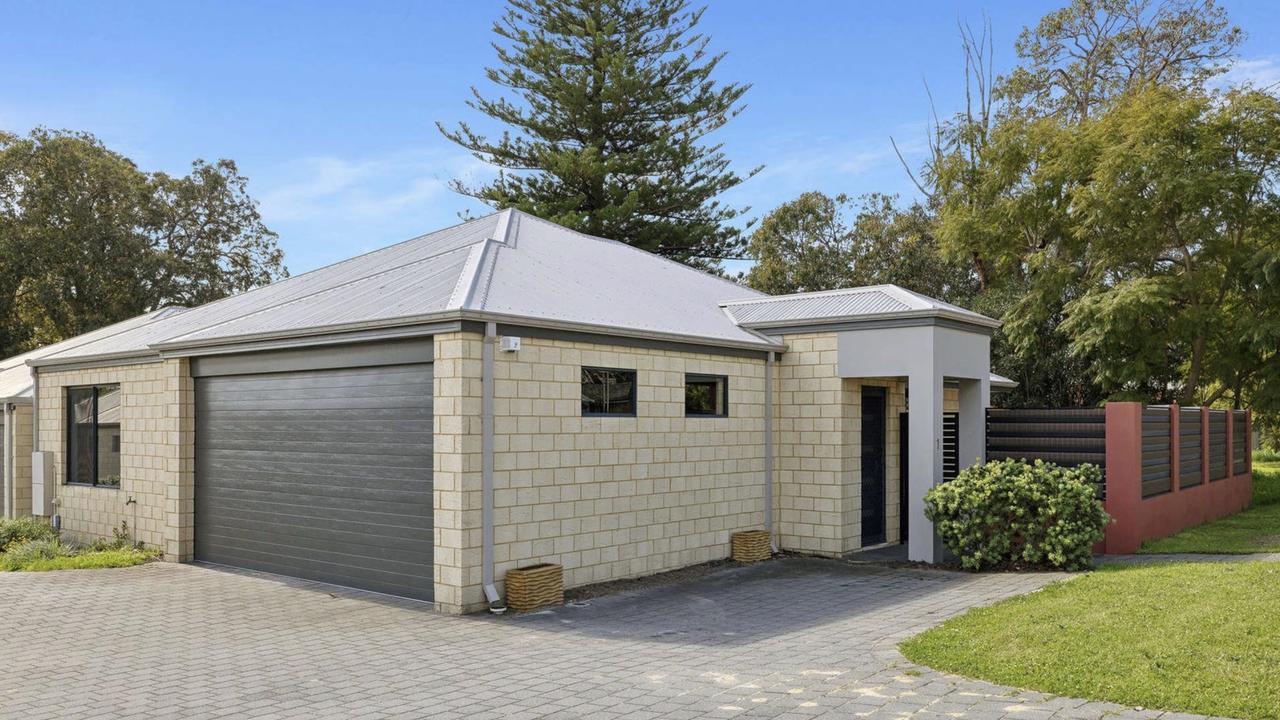
“The demand for housing is lifestyle-driven, creating pressure on local governments to accommodate the growing population,”
Ms David said the strong market includes fewer vacancies and increased competition with interest rates are influencing market dynamics, pushing prices up and adding burden to buyers who anticipated rate hikes.
She said the rental pool’s insufficiencies intensify issues for both renters and potential buyers.
Top 10 House Growth Suburbs in last year
Suburb | Region | Number Sold 12 months | Median Sale Price 12 months | Change in Median Price 12 months |
| Armadale | Perth - South East | 356 | $500,000 | 42.9 |
| Camillo | Perth - South East | 136 | $510,000 | 41.7 |
| Parmelia | Perth - South West | 131 | $545,000 | 39.7 |
| Maddington | Perth - South East | 208 | $580,000 | 38.1 |
| Kelmscott | Perth - South East | 239 | $560,000 | 34.2 |
| Yangebup | Perth - South West | 120 | $735,000 | 34.2 |
| Wanneroo | Perth - North West | 216 | $686,500 | 33.3 |
| Seville Grove | Perth - South East | 205 | $585,000 | 33 |
| Coodanup | Mandurah | 110 | $531,500 | 32.9 |
| Mandurah | Mandurah | 203 | $491,000 | 32.7 |
Top 10 Unit Growth Suburbs in last year
Suburb | Region | Number Sold 12 months | Median Sale Price 12 months | Change in Median Price 12 months |
| Gosnells | Perth - South East | 116 | $425,000 | 38.9 |
| Armadale | Perth - South East | 149 | $390,000 | 32.2 |
| Rockingham | Perth - South West | 324 | $415,000 | 28.9 |
| Osborne Park | Perth - North West | 137 | $388,850 | 27.9 |
| Bentley | Perth - South East | 112 | $486,000 | 24.9 |
| Success | Perth - South West | 102 | $425,000 | 24.4 |
| Midland | Perth - North East | 290 | $380,000 | 22.6 |
| Mandurah | Mandurah | 271 | $385,000 | 22.2 |
| South Perth | Perth - South East | 373 | $605,000 | 21 |
| Como | Perth - South East | 285 | $600,000 | 20 |
Sign up to the Herald Sun Weekly Real Estate Update. Click here to get the latest Victorian property market news delivered direct to your inbox.
MORE: Breakups that led to stars’ dwindling empires
Melbourne dream home gets $5m price cut
Big mistake homehunters make that costs them thousands
david.bonaddio@news.com.au
Originally published as Australian house prices: Top-performing suburbs in every state that have defied the downturn


