
The most powerful graph in Australia right now: Why you need to understand these dots
IT DOESN’T look like much at all: one basic graph, with a few scattered blue dots. But it may determine Australia’s future.

THESE little dots could determine the future of Australia. If you understand them, people will listen to your opinion. If not, you risk looking like a dope.
Sometime next year, after an election it looks like Malcolm Turnbull will win, we’re going to have a big screaming match about tax. Things like raising the GST and cutting company tax.
Whether you’re for change or against it, you need to be able to discuss the dots, which come from this graph.
I admit, this graph may be unappealing to the eye. But it’s actually damn simple and I’m here to put you in a position to argue eloquently on a topic of real social importance — who gets rich and who gets poor.
This piece is designed to get you to understand the dots. And then to get you to understand why they could be totally wrong.
WHAT THE DOTS ARE SAYING
Every time the government reaches into our economy and removes a dollar of tax, it costs the economy more than a dollar.
The reason some taxes cost more? Every time a tax prevents a trade from happening, that shrinks the economy. They call that distortion. For example, it takes a homeowner even longer to save up for a first house if they have to pay stamp duty.
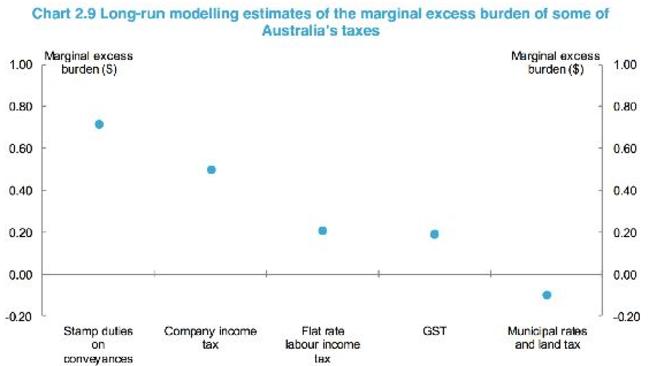
The best guess is every dollar of tax costs us all $1.30 on average. But not all taxes are the same. The dots show how good or bad five different taxes are. The higher the dot, the worse the tax.
• Stamp duty is the worst. It costs the economy an extra 70c. That’s $1.70 cost per dollar of tax.
• Company tax costs the economy an extra 50c, or $1.50 per dollar of tax.
• GST is more like $1.20 per dollar of tax.
• Rates/land tax are cost the economy negative 10c, or 90c per dollar of tax.
If we change from expensive taxes that cause distortion to cheap ones, we get a bigger, stronger economy.
The reason raising the GST is so popular with politicians is they believe the dots. The dots say it is a cheaper, better tax than some of the others, and raising it can make our economy grow.
FOUR REASONS YOU SHOULD BE SCEPTICAL
The dots tell an important story — one many important people believe. But they’re not god’s own gospel. There is room in the debate.
1. The dots come out of an economic model. You have to tell a model how to answer the question before you ask it, and make sure you ask the question very carefully. We can’t be sure the results predicted will apply in the real world. Tax policy expert Peter Davidson calls tax modelling “a very imprecise science.”
2. They haven’t even made a dot for our real income tax, just a “flat tax.” Modelling Australia’s income tax system is too hard. Treasury admits this is “a major limitation.” If the model could show the effects of labour income tax properly, maybe reducing income taxes on the least well-off would become the priority? We will never know.
3. The people who keep barracking for tax reform are often people who have the most to gain. The business community has got right behind cutting the company tax rate, for example. Coincidence? You decide. But a report from the Australian National University says we can’t really trust the modelling of a company tax cut. “The specific benefits of lowering the company tax rate are extremely difficult to test,” ANU tax experts reckon.
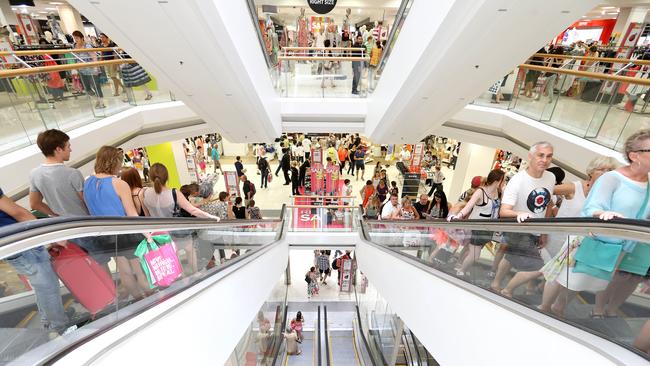
4. There is more to life than a bigger economy. Some taxes, like the GST, may be efficient, but they also hit poorer people harder than richer people. People with the least income spend more of their income on GST than people on the highest income. Raising GST could make the gap between rich and poor even bigger.
You made it to the end! Australia thanks you. The debate about tax needs everybody’s voice in it: The more people understand the arguments that are going around, the better the debate, and the better the future of Australia. Share this article with someone you know.
Jason Murphy is an economist. He publishes the blog Thomas The Think Engine. Follow him on Twitter @jasemurphy.
Major bank flags big risk in rate cut
Australia’s biggest bank says there may be some brief relief for those priced out of owning a home, but there could be a brutal side effect to cutting rates.

ASX 200 hammered on Trump tariffs
Nearly $50bn was wiped off the Australian sharemarket on Monday as fears of a trade war led by US President Donald Trump tariffs ripped through the local market.

Grim truth about Aussie rate cut
Mortgage holders need more than one rate cut to start feeling relief, with only about 53,000 Aussies likely to move away from “at risk” should the RBA cut rates in February.