
Ten signs we’re heading for ‘economic armageddon’
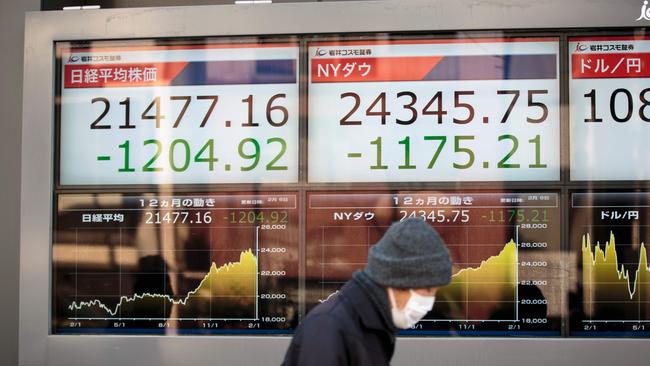
THE $4 trillion bloodbath was the opening act of “economic armageddon” — and Aussies under the age of 44 should be worried.

THIS week’s global share market bloodbath was “a small tremor before the big earthquake” as Australia moves “ever closer to economic armageddon”, a former government economist has warned.
John Adams, a former Coalition policy adviser who last year identified seven signs that the global economy was heading for a crash — later warning the window for action had closed — believes the $4 trillion wipe-out was just the opening act of his apocalyptic prophecy playing out.
“When the economic earthquake hits, don’t be surprised to see soaring interest rates, massive falls in asset prices [like] shares, real estate and bonds, higher unemployment and widespread bankruptcies,” he said.
Adding to previously identified economic indicators such as household debt and record low interest rates, Mr Adams has expanded his list of warning signs to 10, including rising inflation — fear of which had a hand in the latest sell-off.
“Against a whole range of economic and financial metrics, the Australian and international bubble which I warned about in 2017 has continued to grow larger over the past 12 months,” he said.

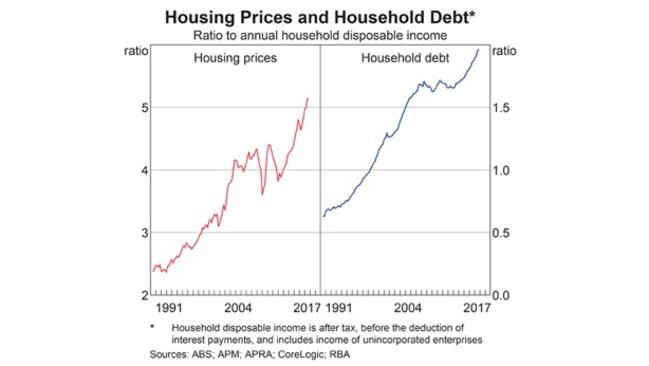
“Australian household debt has never been higher — now at nearly 200 per cent as a proportion of disposable income — household savings have slumped, the US share market is now in a bigger bubble than 1929, risky derivatives are now being sold in significant quantities and global debt is $US80 trillion more than it was in 2008.”
Mr Adams said Australians born after 1973 — people under the age of 44 — had never experienced a major economic downturn as a working adult and hence needed to ensure they didn’t succumb to “normalcy bias”.
“Australians should be concerned about what lies ahead for themselves and the country as a whole,” he said, predicting a collapse likely to be more severe than the 1991 recession and which may potentially rival both the 1890 and 1929 depressions.
Ordinary Australians can take some precautions for hard economic times, he added, by reducing their personal spending, increasing savings and having more cash on hand, paying down debt, reducing their exposure to risky or overvalued assets and managing the risk of rising prices, including interest rate payments.
“We all must assume personal responsibility and take pre-emptive action to ensure that we are able to ride out harsher economic times that are coming to our shores.”
JOHN ADAMS’ 2018 TEN SIGNS OF ECONOMIC ARMAGEDDON
• Sign #1: Record Australian Household Debt
“According to the Reserve Bank of Australia, Australian household debt as a proportion of disposable income continues to soar and reached an all-time high in September 2017 of 199.7 per cent as the Australian Bureau of Statistics recently included debt from self-managed superfunds into this statistic.
“The RBA has continued to note in recent months that the growth in household debt is faster than the growth in household disposable income meaning that household debt to disposable income ratio is expected to increase in the coming months.
“To give some perspective, American households entered the Global Financial Crisis with a household debt to disposable income ratio of approximately 130, meaning that Australians today are carrying 35 per cent more debt relative to when Americans faced the biggest financial collapse since the Great Depression.”
• Sign #2: Falling Australian Household Savings
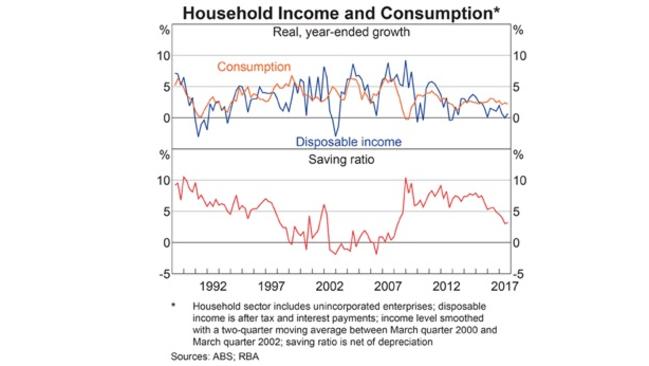
“Coinciding with the rise in household debt, Australian household savings have fallen to their lowest level since the 2008 GFC.
“According to the ABS, the Household Saving Ratio (seasonally adjusted) has fallen from a high of 10.1 per cent in the December quarter of 2008 to 3.0 per cent and 3.2 per cent in the June and September quarters of 2017 respectively.
“Alarmingly, the Turnbull Government noted in its 2017-18 MYEFO Statement released before Christmas, that it expects household savings to fall even further into the near future.”
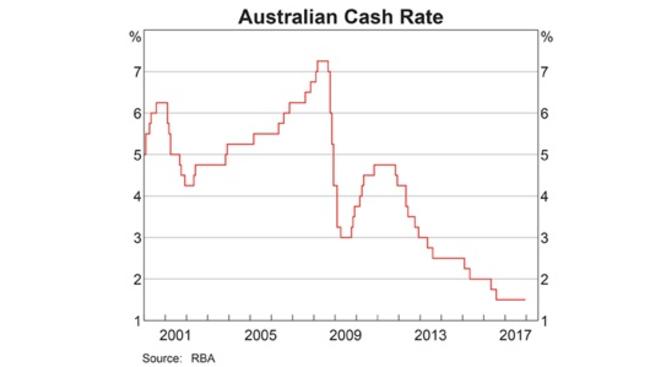
• Sign #3: Continued Record Low Australian Interest Rates
“Despite foreign central banks raising interest rates (see sign #8), the RBA has continued to keep the official cash rate at 1.5 per cent.
“The Turnbull Government is trying to manage financial risk among Australia’s financial institutions and households through new macroprudential controls via the Australian Prudential Regulation Authority.
“These controls are rules which place additional requirements on financial institutions to ensure that they don’t take excessive risks, for example, placing limitations on banks to offer interest-only mortgages.
“However, in December 2012 former RBA Governor Glenn Stevens warned that interest rates kept too low for too long would prove macroprudential controls ineffective in controlling systemic financial risk as people would be driven to over borrow given the cheap rates.”
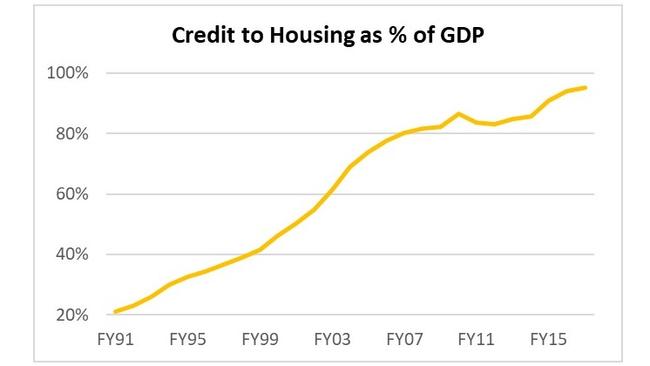
• Sign #4: Growing Australian Housing Bubble
“Concentration of credit in the Australian housing market continued to grow by 7.23 per cent from June 2016 to June 2017. As of June 2017, Credit to Housing as a proportion of Australian Gross Domestic Product reached a 26-year high of 95.33 per cent compared to 21.07 per cent in June 1991.
“Over the same period, credit which has been directed at the business sector or to other personal expenses have remained relatively steady as a proportion of GDP.”
Sign #5: Continued Increase in Global Debt
“Global debt continues to grow, driven especially by rapid growth of debt in emerging economies.
“According to the Institute for International Finance’s January 2018 Global Debt Monitor Report, global debt reached a record high of $US233 trillion in the third quarter of 2017 or 318 per cent of global GDP, representing growth in global debt of 8 per cent through the first three quarters of 2017.
“Global debt is now $US80 trillion higher than the end of 2007 with current interest rates substantially lower relative to the pre-GFC period.”

• Sign #6: Major International Asset Bubbles Keep Growing
“The past 12 months has seen significant growth in major asset class values (particularly shares) across the world which has been fuelled by the significant increase in global debt.
“For example, according to the PE Shiller Index, the US share market (as measured by the price of a company’s share relative to average earnings over the past 10 years for US companies in the S&P 500) is now at its second highest valuation level in history at 32.62, with the highest being the 1999 dotcom bubble.
“According to the PE Shiller Index, the bubble in US share market is now bigger than the peak reached in September 1929 which was 32.54.”

• Sign #7: Increasing Inflation
“In late 2017, inflation started to emerge in developed economies, beating the targets set by national governments and central banks. This emerging inflation was driven in part from rising global oil prices which increased by 51 per cent, along with increases in other commodities, over the past seven months.
“In 2017, the US Producer Price Index hit an annual rate of 3.1 per cent (a six-year high) and the US Consumer Price Index grew by an annual rate of 2.1 per cent whereas in the UK, inflation reached an annual rate of 3.1 per cent. In both the US and UK cases, inflation as measured by the CPI is above the stated 2 per cent target of the US Federal Reserve and the Bank of England.
“Other developed countries such as Canada and Japan also saw a notable pick-up in inflation during 2017. Higher rates of inflation will put pressure on the value of bonds and currencies, placing countries that do not deal with inflation through higher interest rates at a competitive disadvantage as investors make lower returns.”
• Sign #8: Tightening Monetary Policy and Rising Global Interest Rates
“Many foreign governments in the past year have been tightening monetary policy (either through reducing or ending quantitative easing or through ‘quantitative tightening’) as well as raising interest rates.
“During late 2016 and all of 2017, interest rates were raised in both developed economies such as the US (four times, or 1 per cent), Canada (three times, or 0.75 per cent), or the UK (one time or 0.25 per cent) as well as smaller and emerging economies such as the Czech Republic, Mexico, Malaysia and Romania.
“Interest rates across the world are expected to continue to rise in 2018 as global economic growth and inflation continue to rise. Higher interest rates will make the ability to service global debt increasingly more difficult.”
• Sign #9: Inverted and Flattening Yield Curves
“The US Government bond yield curve has continued to significantly flatten over 2017. In early 2018, the difference between the two-year and the 10-year bond yield reached approximately 0.5 per cent, which is the smallest difference since 2007.
“The Chinese bond yield curve (i.e. the difference in interest rates between the five-year and the 10-year bond) briefly inverted twice in 2017 and is now approximately less than 0.1 per cent.
“Inverted yield curves (i.e. where long-term debt instruments have a lower yield than short-term debt instruments of the same credit quality) are known as a market predictor of a coming market crash or broader economic recession.”
• Sign #10: Return of Risky Derivatives
“According to the Bank for International Settlements, the value of the over-the-counter derivatives market (notional amounts outstanding) remained high between June 2016 and June 2017 to stand at $US542 trillion.
“Many of these derivatives contracts (which are agreements that allow for the possibility to purchase or sell some other type of financial instrument or non-financial asset) are concentrated on the balance sheets of leading global financial and banking institutions, are bought and sold privately, involve significant complexity and carry significant counter-party risk that many institutions and government regulators struggle to understand.
“In November 2017, a research report from Citibank reported that ‘Synthetic Collateral Debt Obligations’, which were one of the main financial instruments responsible for the 2008 GFC, were now back and are being sold to investors in significant quantities and is expected to top $US100 billion by the end of 2017, up from $US20 billion in 2015.”

‘Very welcome’: Huge August rate cut hint
A key Reserve Bank official has hinted at an August rate cut after welcoming new inflation figures showing the lowest rate since 2021.

Billions to be slashed from student debt
Aussies with student debt will have thousands of dollars taken off their bill, with Labor passing one of its key election promises to young voters.

Australia’s fresh shot at Trump on tariffs
Jim Chalmers has taken a fresh shot at Donald Trump’s tariffs, partly blaming them for higher inflation in the US.