Stats show how far we’ve come in 50 years
AS AUSTRALIA prepares for a day of sun, sand and sickies, the ABS has dug into its archives to reveal some surprising facts.
WHICHEVER way you slice it, Australia has come a long way in 50 years.
Luckily, the Australian Bureau of Statistics has plenty of ways to slice it. As the nation gears up for a day of sun, sand and sickies, the ABS has dug into its archives to offer news.com.au readers this look back at then and now — by the numbers.
While Australia Day presents a great opportunity for many of us to have a barbecue, listen to the radio, and spend time with family and friends, it also provides a chance to think about the past, present and future of our nation.
So this Australia Day we’re taking the opportunity to have a dig through the dusty old books in the ABS basement. We’ve found Australia’s 1967 Year Book, and Australia has certainly changed in the 50 years since then.
MY, HOW WE’VE GROWN
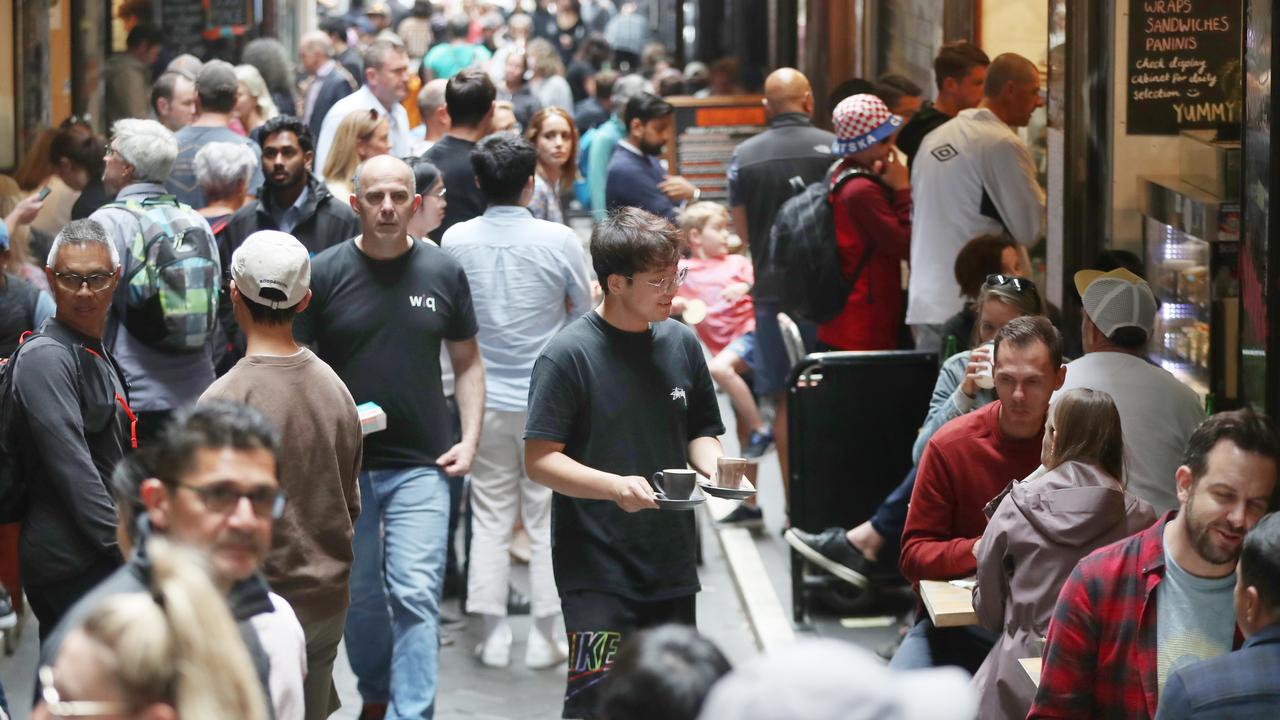
The 1966 Census recorded a national population of 11,540,764, though it’s important to note that a historic referendum — which recognised Aboriginal Australians in the Census and Australia’s population statistics — took place the following year. (This would have increased Australia’s official population by 40,081, according to the Census data).
Our population passed 24 million in February 2016 and this Australia Day will see a national population of 24.3 million. You can check out our Population Clock here.
BUT WE HAVEN’T GROWN LIKE DELHI
The 1967 Year Book contained a table comparing Australia’s city populations with those of world cities. At the time, Sydney’s urban area was home to 2.5 million people, comparable to Delhi with 2.7 million. ABS data has Sydney’s current population now nudging 5 million people, while Delhi has stormed ahead to an estimated 25 million, larger than the whole of Australia.
THESE DAYS, WE’RE WAITING FOR MARRIAGE
Back in 1966, the average age of a bride was 24.0 years, and a groom was 27.1 years. These ages had actually been falling in the years prior to 1966, but have since risen significantly.
The latest data shows brides averaging 29.8 years of age at the time of their marriage, and males an average of 31.8 years of age. There has been an even bigger switch in who officiates at the wedding; in 1966 civil celebrants conducted 10.8 per cent of weddings, and today it’s 74.9 per cent.
AVERAGE WAGES GET A RAISE
The average earnings for a week’s work in 1965-66 was $57 (around $740 in today’s dollars), and minimum wages for women were set around 30 per cent lower than for men.
We measure average wages slightly differently now, but the newest data on average weekly earnings for Australia is $1160 per week. The difference would be much larger if it weren’t for the rise in part-time employment in recent decades, with parents and university students prominent among those who are working part time hours in 2017.
THE OLD DAYS OF A JOB FOR LIFE
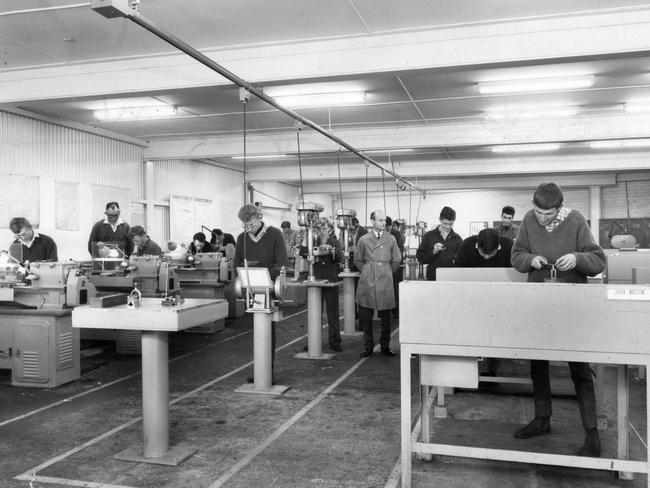
Fifty years ago, the majority of Australians who worked were men working fulltime well into their 60s. Today, far more people are working part-time, or in temporary or casual jobs. Retirement ages vary much more, with a greater proportion of men not participating in the labour force once they are older than 55. Nowadays, 45 per cent of working Australians are women, compared with just 30 per cent 50 years ago.
WE’RE MORE EDUCATED, TO A CERTAIN DEGREE
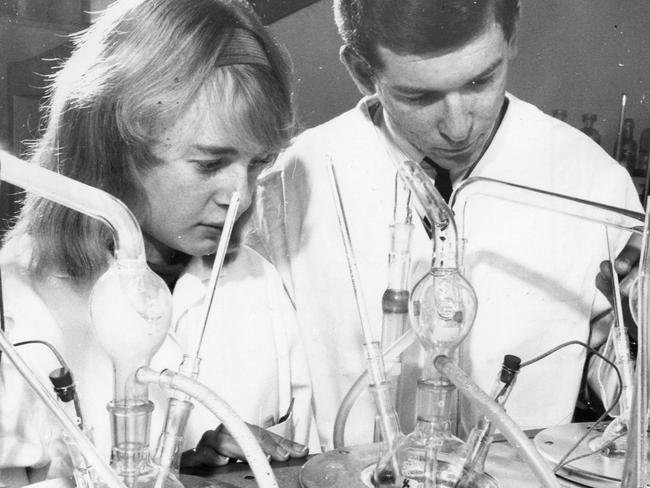
Universities used to be for the select few, but the shift of the Australian economy towards services has helped to bring university education well into the mainstream.
In 1966, Australia’s universities had 86,466 students enrolled in Degree (or higher) courses, but by May 2016 this number had rocketed to 1,287,600. We’re more educated than ever before, and higher education has also become one of Australia’s most important exports.

FLYING OVERSEAS HAS TAKEN OFF
Flying overseas was an exclusive experience half a century ago, with Australia recording a total of 5237 international aircraft movements in 1965-66.
In 2015, international airlines operated 179,772 flights in or out of Australia, carrying more than 34 million passengers with more people travelling for work, tourism, and to visit family and friends.
THE PAST 50 YEARS HAVE MADE US OLDER
The medical advances of recent decades have contributed to a significant boost in the life expectancy of Australians. Males born in the mid-1960s were expected to live for an average of 67.6 years, while females were expected to live for an average of 74.2 years.
Our newest data indicates an expectancy of 80.4 years for males, and 84.5 years for females. Additionally, the average Australian is older today than ever before, with a 2015 median age of 37.4 years.
PAPUA AND NEW GUINEA WERE TERRITORIES OF AUSTRALIA
Papua and New Guinea, which now comprise the independent nation of Papua New Guinea (PNG), were still Australian territories in 1967, having been transferred to Australian control by the British Government early in the 20th century. PNG became an independent nation in 1975, and Australia today is one of its largest trading partners.
Fifty years ago there were no mobile phones, home PCs, or plasma TVs. There was no such thing as the A-League, the AFL or women playing sport in national competitions. Socially, multiculturalism hadn’t become part of the Australian vocabulary. How the times have changed. We wonder what Australia will look like in another 50 years.
This article was provided to news.com.au by the Australian Bureau of Statistics

