
Champion Data explains the meaning of 12 AFL stats
EVERYONE knows what a kick, mark and handball is but footy stats these days go to a whole new level. Here is our footy fan’s guide to metres gained, kick rating and more.
AFL News
Don't miss out on the headlines from AFL News. Followed categories will be added to My News.
STATS were easy when kicks, marks and handballs were all that was recorded in the paper the next day.
When inside-50s and clearances were added we were still pretty sure what was going on.
Then we started hearing about score involvements, turnovers, giveaway turnovers, forced turnovers ... and it felt like you needed a degree to know what was happening on the footy field.
Luckily, the AFL’s stats gurus at Champion Data are here to help.
AFLW NEWS: AFL CLUBS FIGHT FOR WOMEN’S TEAMS
DAVID KING: SAFE SAINTS MUST BE DARING
They have spent years finetuning the stats that record what really matters in games, which is why they are used by all the AFL clubs and form the unique SuperCoach scoring system.
To answer one common question from the start, possessions and disposals are not the same thing, although the terms are often used interchangeably. A possession is how a player wins the ball and a disposal is how he gets rid of it. So it is possible for a player to win a possession — for example, by marking just before the siren, but not record a disposal.
Here are 12 more misunderstood stats and what they mean — and who is leading the AFL so far this season.
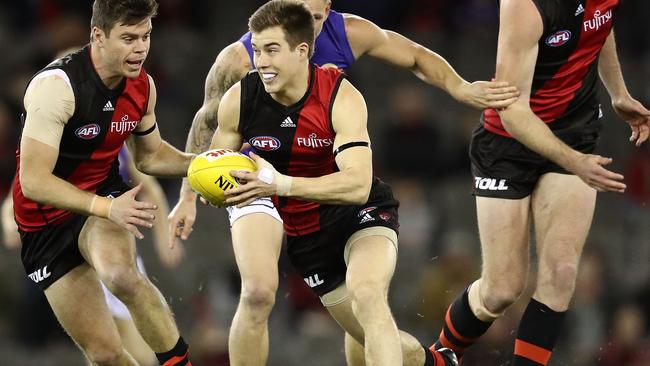
METRES GAINED
Net distance gained with the ball by a player during a match by running with the footy, kicking or handballing. Backwards kicks and handballs take away from the total of metres gained towards goal to give a final total.
TOP FIVE
1 Zach Merrett Essendon 577 (average)
2 Dustin Martin Richmond 564
3 Dayne Zorko Brisbane Lions 564
4 Sam Docherty Carlton 535
5 Michael Hibberd Melbourne 526
PRESSURE ACT
Each disposal has pressure assigned to it, ranging from no pressure for a set position to closing, corralling, chasing or physical pressure. A pressure act is when a player has applied either closing, corralling, chasing or physical pressure.
TOP FIVE
1. Tom Liberatore (WB) 30.9 (average)
2. Liam Shiels (Haw) 26.7
3. Brad EbertPort (Adel) 26.1
4. Dayne Zorko (BL) 25.7
5. Tom Mitchell (Haw) 25.2
PRESSURE POINTS
Weighted sum of pressure acts. Under the Champion Data pressure point scoring system physical pressure acts are worth 3.75 points, closing pressure acts are worth 2.25 points, chasing pressure acts are worth 1.50 points, and corralling pressure acts which are worth 1.20 points.
TOP FIVE
1. Tom Liberatore Western Bulldogs 72.6 (average)
2. Brad Ebert Port Adelaide 64.9
3. Liam Shiels Hawthorn 64.7
4. Rory Sloane Adelaide 63.0
5. Dayne Zorko Brisbane Lions 62.7
KICK RATING
The difference between a player’s expected hit rate (number of times he hits an intended target) and actual hit rate. A negative kick rating indicates a player is not executing the kicks as well as the competition average and a positive kick rating shows a player is hitting the target more often than the competition average. Note that a kick that goes to a teammate counts as effective even if it doesn’t travel the 15m required for a mark.
TOP FIVE
1. Scott Pendlebury Collingwood +11.3%
2. Jacob Weitering Carlton +9.5%
3. Adam Tomlinson GWS Giants +9.3%
4. Lachie Plowman Carlton +9.3%
5. Josh J. Kennedy West Coast +9.1%
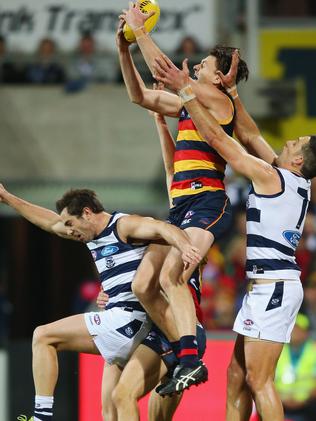
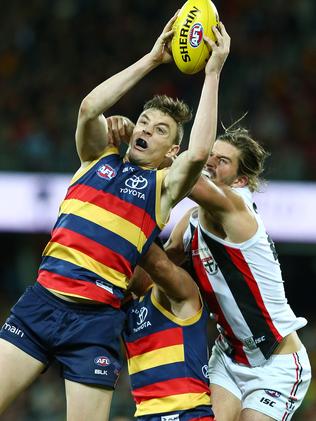
INTERCEPT POSSESSION
Any possession that is won that breaks an opposition chain.
TOP FIVE
1. Jake Lever Adelaide Crows 9.7 (average)
2. Alex Rance Richmond 9.0
3. Elliot Yeo West Coast 8.5
4. Jeremy Howe Collingwood 8.5
5. Jeremy McGovern West Coast 8.2
TACKLE EFFICIENCY
Percentage of physical pressure acts that lead to an effective tackle (that results in no disposal or an ineffective or clanger disposal).
TOP FIVE
1. Brodie Grundy Collingwood 79.4%
2. Nathan Jones Melbourne 79.2%
3. Jarryd Lyons Gold Coast 79.1%
4. Alex Neal-Bullen Melbourne 78.3%
5. Luke McDonald North Melbourne 76.7%
SCORE INVOLVEMENT
Any scoring chain a player was involved in with either a disposal, hitout-to-advantage, kick-in or knock-on. If a player has more than one disposal in the same chain, he is only credited with one score involvement. A score assist is the disposal, hitout-to-advantage or knock-on that directly preceeds a score. (A hitout-to-advantage is a hitout that leads to a teammate gaining direct possession of the ball with the opportunity to dispose of it).
TOP FIVE
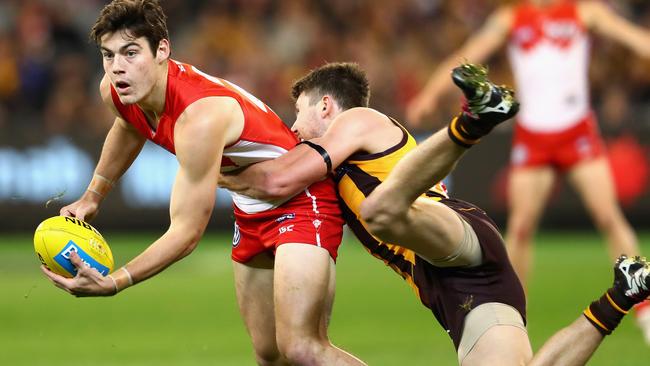
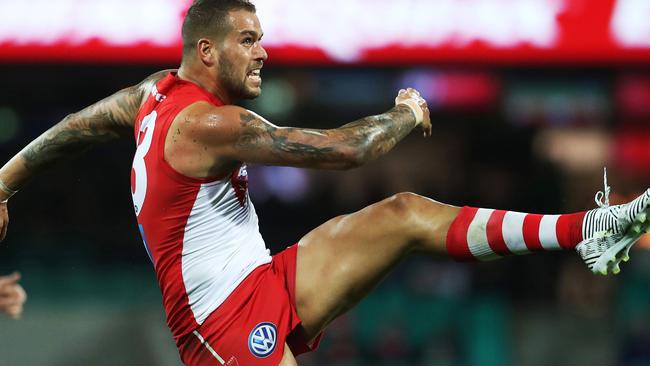
1. Lance Franklin Sydney Swans 9.5 (average)
2. Taylor Walker Adelaide 9.0
3. Gary Ablett Gold Coast 8.7
4. Josh J. Kennedy West Coast 8.7
5. Jarrad Waite North Melbourne 8.6
SCOREBOARD IMPACT
A score assigned by Champion Data by combining points scored from goals and behinds plus score assists. Goal and goal assists are worth six points each, and behinds and behind assists are worth one point each.
TOP FIVE
1. Taylor Walker Adelaide 323
2. Eddie Betts Adelaide 285
3. Lance Franklin Sydney 279
4. Josh Kennedy West Coast 273
5. Robbie Gray Port Adelaide 271
TURNOVER
Losing possession to the opposition in general play. General play excludes events that happen between a stoppage and the clearance.
TOP FIVE
1. Zach Merrett Essendon 76
2. Matt Crouch Adelaide 74
3. Dustin Martin Richmond 69
4. Tom Mitchell Hawthorn 68
5. Dayne Zorko Brisbane Lions 66
GIVEAWAY TURNOVER
A turnover that directly hands possession to the opposition, usually via a clanger disposal. Giveaway turnovers can be forced or unforced.
TOP FIVE
1. Dustin Martin Richmond 34
2. Matt Crouch Adelaide 32
3. Zach Merrett Essendon 32
4. Jarryd Lyons Gold Coast 31
5. Tom Mitchell Hawthorn 30
FORCED TURNOVER
A turnover committed under significant pressure, which directly results in an opposition possession. For example, when a player is tackled as he kicks the ball and it is marked by an opponent.
TOP FIVE
1. Dustin Martin Richmond 19
2. Jeremy McGovern West Coast 18
3. Brodie Smith Adelaide 18
4. Sam Docherty Carlton 18
5. Bradley Hill Fremantle 17

UNFORCED TURNOVER
A turnover committed under little or no pressure, which directly results in an opposition possession.
TOP FIVE
1. Tom Mitchell Hawthorn 22
2. Matt Crouch Adelaide 21
3. Andrew Gaff West Coast 20
4. Brad Crouch Adelaide 20
5. Gary Ablett Gold Coast 20
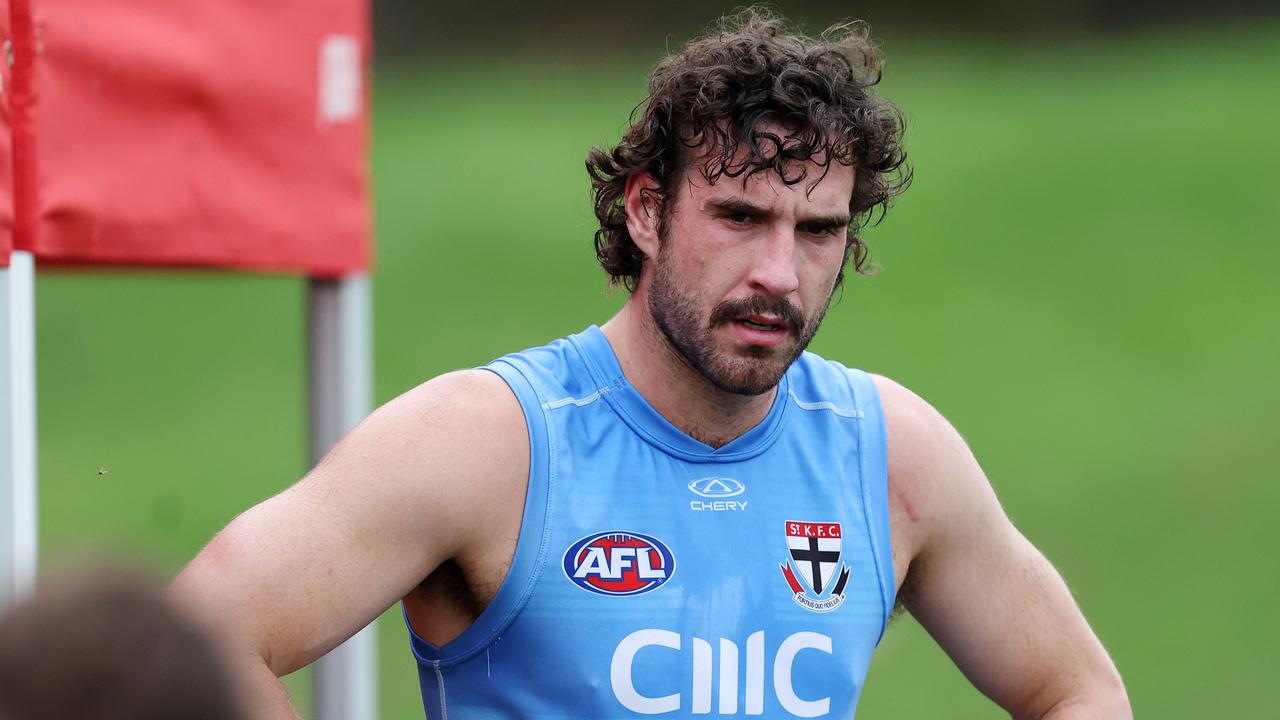
King avoids ACL tear, Saints provide Sinclair, Wood update
St Kilda fans can breathe a collective sigh of relief after it was revealed star forward Max King has avoided a serious knee injury. Plus, the latest on Jack Sinclair and Mason Wood.
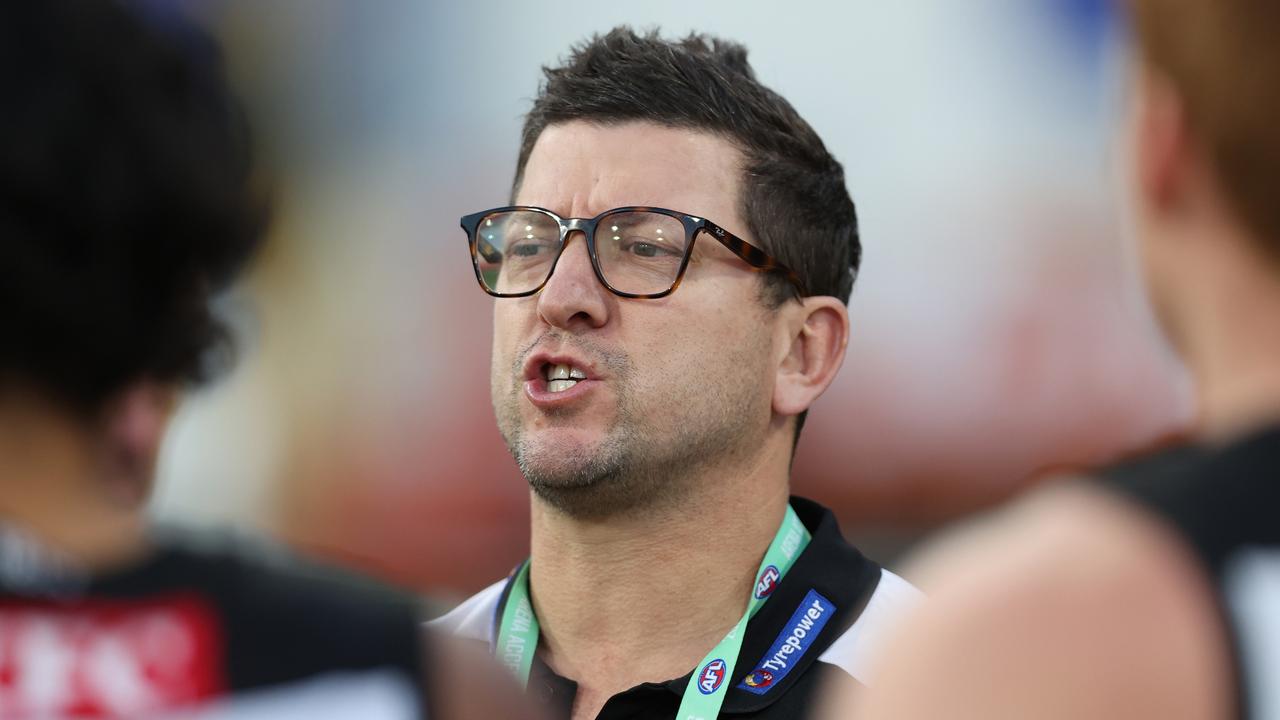
Port fans left in dark about succession plan stunner
Ken Hinkley and Port Adelaide’s top brass have remained quiet — at least publicly — after news broke of a impending coaching succession plan. MATT TURNER has the latest.