
How median household incomes compare across Victoria
New Census data reveals the median household income across Victorian suburbs. See if you are wealthier than your neighbours with with our interactive map.
National
Don't miss out on the headlines from National. Followed categories will be added to My News.
The average Victorian household is earning $340 more each week than it was five years ago, but people are unlikely to feel better off as the cost of living steams ahead.
New Census figures reveal the median household income was $1759 a week (about $91,470 a year) in 2021, up from $1419 a week ($73,790 a year) in 2016.
That’s 24 per cent growth over five years - ahead of the national trend of 21.4 per cent.
Job site Indeed’s senior economist for the Asia Pacific region Callam Pickering said Australian wages were increasing “nowhere near as fast as inflation”.
“Adjusted for inflation, Australian households have experienced the largest wage cut since the introduction of the GST,” Mr Pickering said.
“Purchasing power has declined quite a bit.”
He said workers had not received a “meaningful wage increase” despite the low unemployment rate meaning quality employees are in short supply.
“Demands for higher wages are going to become louder over the next 12 months,” he said.
“Households won’t be particularly happy they are going backwards and (incomes are) not keeping pace.”
Over the past five years, Victoria’s largest income jump was recorded in the Melbourne suburb of Carlton, where the median increased 130 per cent, to $1289 a week.
Other standout inner-city areas were Burwood (up 39 per cent to $1564) and West Footscray-Tottenham (up 37 per cent to $1988).
Further out, incomes ballooned in the small communities of French Island (median $1014), Rockbank-Mount Cottrell ($2123), Ararat Surrounds ($1384) and Werribee South ($1802).
On the flip side, the median household income shrunk in the low-population areas of Wilsons Promontory, Melbourne Airport and Alps-West.

Mr Pickering said income growth was typically the result of changes in demographics, industry composition and population growth – and different regions were experiencing different trends.
“People relocating during the pandemic would be contributing to this situation,” he said.
“The fact more people were working from home (last year) compared to 2016 would enable a situation where people have jobs that would normally be based in Sydney (for example), but they are living in the regions.”
He said new or growing industries could also help a region shift towards higher-income roles.
“It might just be that a high-income industry, such as construction, is getting a little bit bigger compared to five years ago and that flows through to more income in that region, which increases wages for other industries as well,” he said.
TOP 10 MEDIAN VICTORIAN HOUSEHOLDS BY SUBURB OR REGION
Median weekly household income 2021
Ivanhoe East - Eaglemont $2,914
Glen Iris - East $2,914
Research - North Warrandyte $2,831
Warrandyte - Wonga Park $2,779
Lysterfield $2,756
Ashburton $2,743
Brighton East $2,720
Brighton $2,718
Surrey Hills (West) - Canterbury $2,709
Narre Warren North $2,659
BOTTOM 10 MEDIAN VICTORIAN HOUSEHOLDS BY SUBURB OR REGION
Median weekly household income 2021
Alps - West $699
Maryborough $876
Upper Yarra Valley $900
Norlane $926
Orbost $926
Braeside $933
Morwell $942
Maryborough Surrounds $956
Avoca $985
St Arnaud $993
SOURCE: 2021 Census


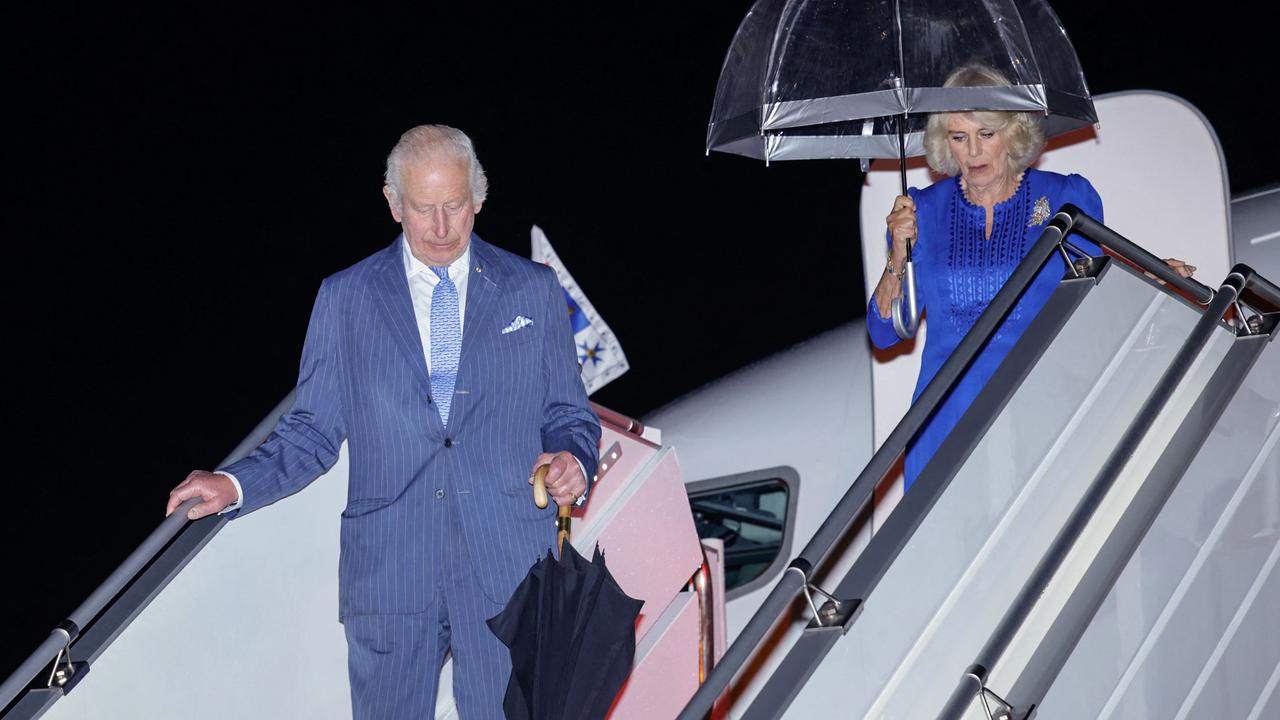
King Charles reveals huge Pacific move
After touching down in Australia on his five-day tour, King Charles has announced a major commitment to Pacific nations to build a “brighter future for all”.

Man charged over alleged ‘horrific’ rape
A man has been charged over an alleged “horrific” historic abduction and rape of a teenage woman after police reopened their investigation into the decades-old incident.