
Why NSW had most marginal Yes vote of any state
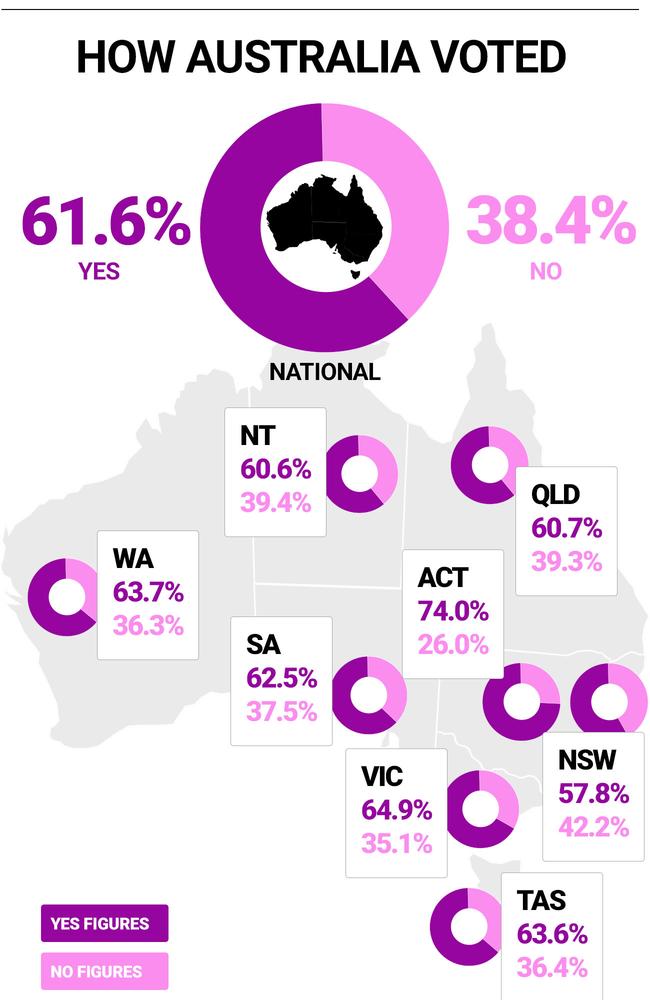
THE nation has voted Yes to same-sex marriage, with the ACT most strongly in favour at 74 per cent and NSW the least at 57.8 per cent.
gay marriage
Don't miss out on the headlines from gay marriage. Followed categories will be added to My News.
ONE statistic that has surprised many Australians in the same-sex marriage vote is that New South Wales had the most marginal Yes vote of any state.
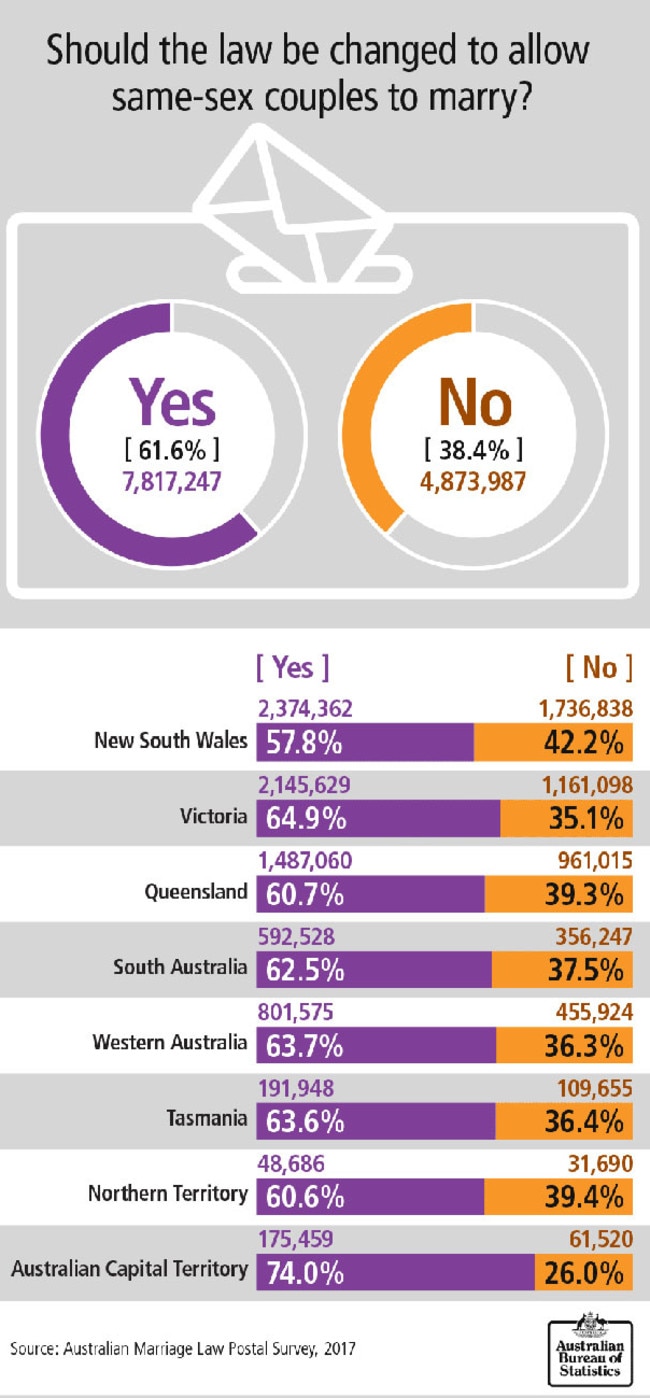
Just 57.8 per cent (2,374,362 people) voted Yes, with a significant 42.2 per cent (1,736,838 people) voting No.
Every other state was above 60 per cent Yes, with the Australian Capital Territory top at 74 per cent, and Victoria close behind, on 64.9 per cent.
The ACT has a small voting population, with 175,459 ticking Yes and 61,520 No, but you might have expected NSW and Victoria to be comparably progressive.
I expected a massive Yes victory in NSW. Surprised to learn it was the closest margin in the country
— Alfonso Zambrano (@azambrano72) November 15, 2017
Big bragging rights for Qld over NSW. We smashed 'em on yes & our rural seats outpolled Western Sydney. Sir Joh legacy erased #ssm #origin
— Margo Kingston (@margokingston1) November 15, 2017
Still so disappointed with NSW though #NSWpol #SSM
— Philippa Nicole Barr (@philippabarr_) November 15, 2017
In fact, NSW’s metropolitan electorates were some of the highest Yes voting seats in the country, with Sydney tying with Melbourne for the nation’s most strongly in favour, at 83.7 per cent.
Even rural seats in western NSW were relatively strongly skewed to Yes.
It was seats in south-west Sydney, many of which have large socially conservative immigrant populations, that were most likely to vote No.
Out of 150 Federal Electoral Divisions, 133 recorded a majority Yes response, and just 17 divisions recorded a majority No response.
Most of these were Labor-held western Sydney electorates, including the top No-voting seat of Blaxland, held by ALP frontbencher Jason Clare.
Blaxland, where 73.9 per cent voted No, takes in the working-class suburbs of Bankstown, Auburn and Chester Hill.
The next highest No-voting electorate was nearby Watson, held by Labor MP Tony Burke, which includes Punchbowl and Lakemba, at 69.6 per cent. They were followed by McMahon, Fowler and Werriwa, Parramatta and Chifley, all in Sydney’s west or south-west.
The Australian Bureau of Statistics this morning revealed Australians had voted Yes to same-sex marriage, with 61.6 per cent in favour and 38.4 per cent against.
There were 7,817,247 votes for Yes and 4,873,987 for No. A further 36,686 votes, or 0.2 per cent, were unclear.
Former Prime Minister Tony Abbott’s seat of Warringah recorded a 75 per cent Yes vote, while PM Malcolm Turnbull’s electorate of Wentworth was an even higher Yes at 80.8 per cent.
They were the top two Liberal-held Yes electorates in NSW, with Mr Abbott’s electorate coming in 10th highest overall.
BREAKDOWN BY STATE AND TERRITORY
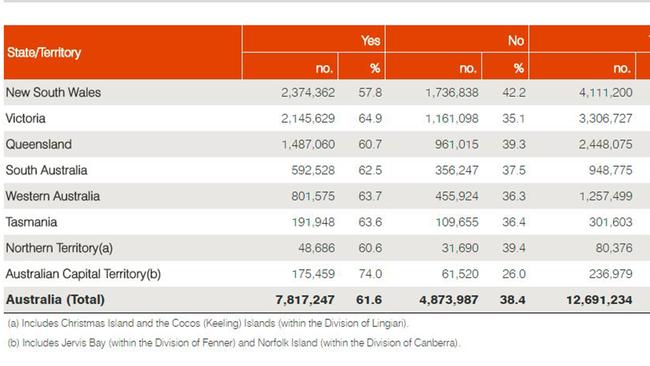
The Australian Capital Territory was the highest Yes voting state at 74 per cent to 26 per cent No. Victoria came second, with 64.9 per cent voting Yes and 35.1 per cent No.
Western Australia was 63.7 per cent Yes and 36.3 per cent No, with Tasmania close behind on 63.6 per cent Yes and 36.4 per cent No.
South Australia was next with 62.5 per cent Yes and 37.5 per cent No, followed by Queensland with 60.7 per cent Yes and 39.3 per cent No.
The Northern Territory came just after on 60.6 per cent Yes and 39.4 per cent No, with NSW bringing up the rear on 57.8 per cent Yes and 42.2 per cent No.
BREAKDOWN BY ELECTORATE (%)
YES:
Sydney, NSW (Tanya Plibersek): 83.7 —joint highest Yes
Melbourne, Vic (Adam Bandt): 83.7 —joint highest Yes
Wentworth, NSW (Malcolm Turnbull): 80.8 —includes Sydney suburbs North Bondi, Point Piper
Grayndler, NSW (Anthony Albanese) 79.9—includes Sydney suburbs Leichhardt, Rozelle
Brisbane, Qld (Trevor Evans) 79.5 —highest in Queensland
Warringah, NSW (Tony Abbott): 75 —includes Sydney suburbs Mosman, Dee Why
Denison, Tas (Andrew Wilkie) 73.8 —central Hobart, highest in Tasmania
Curtin, WA (Julie Bishop): 72.2 —west of Perth, highest Yes vote in Western Australia
Adelaide, SA (Kate Ellis) 70.1 —highest in South Australia
Dickson, Qld (Peter Dutton): 65.2 —north-west of Brisbane, includes Moreton Bay Region
Maribyrnong, Vic (Bill Shorten): 59.9 —includes Melbourne suburbs Moonee Ponds, Essendon
Menzies, Vic (Kevin Andrews): 57 —includes Melbourne suburbs Croydon Hills, Doncaster
'Yes' vote strongly correlates (78%) with no religion (no shock) at electorate level pic.twitter.com/goshzL029h
— Ben Phillips (@BenPhillips_ANU) November 15, 2017
NO:
Blaxland, NSW (Jason Clare): 73.9 —includes Sydney suburbs Bankstown, Auburn, highest No
Watson, NSW (Tony Burke): 69.6—includes Sydney suburbs Punchbowl, Lakemba
McMahon, NSW (Chris Bowen): 64.9—includes Sydney suburbs Blacktown, Fairfield
Bennelong, NSW (vacant) 50.2—includes Sydney suburbs Ryde, Epping
There were just two No-voting electorates in Victoria:
Calwell (Maria Vamvakinou) 56.8—includes Melbourne suburbs Campbellfield, Roxburgh Park
Bruce (Julian Hill) 53.1—includes Melbourne suburbs Dandenong North, Wheelers Hill
There were just three No-voting electorates in Queensland:
Maranoa, Qld (David Littleproud): 56.1—southwest Qld, includes Kingaroy, Stanthorpe
Kennedy, Qld (Bob Katter): 53.3—northern Qld, between Cairns and Townsville
Groom, Qld (John McVeigh): 50.8—west of Brisbane, around the city of Toowoomba
THE TURNOUT
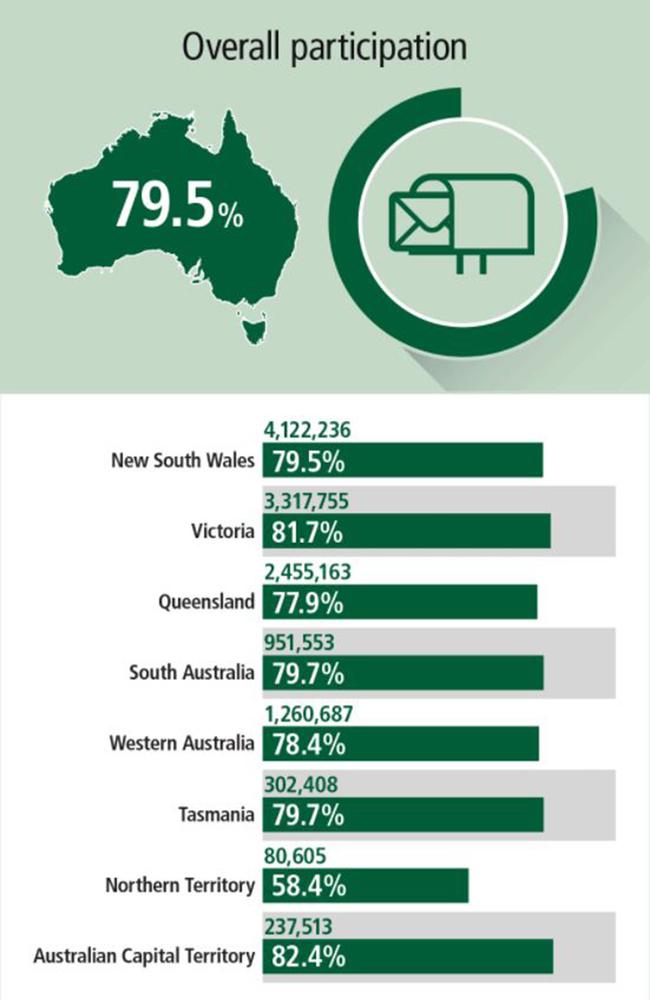
Nearly eight out of 10 Australians responded to the survey, or 12,727,920 people out of the 16,006,180 who were posted one — a participation rate of 79.5 per cent.
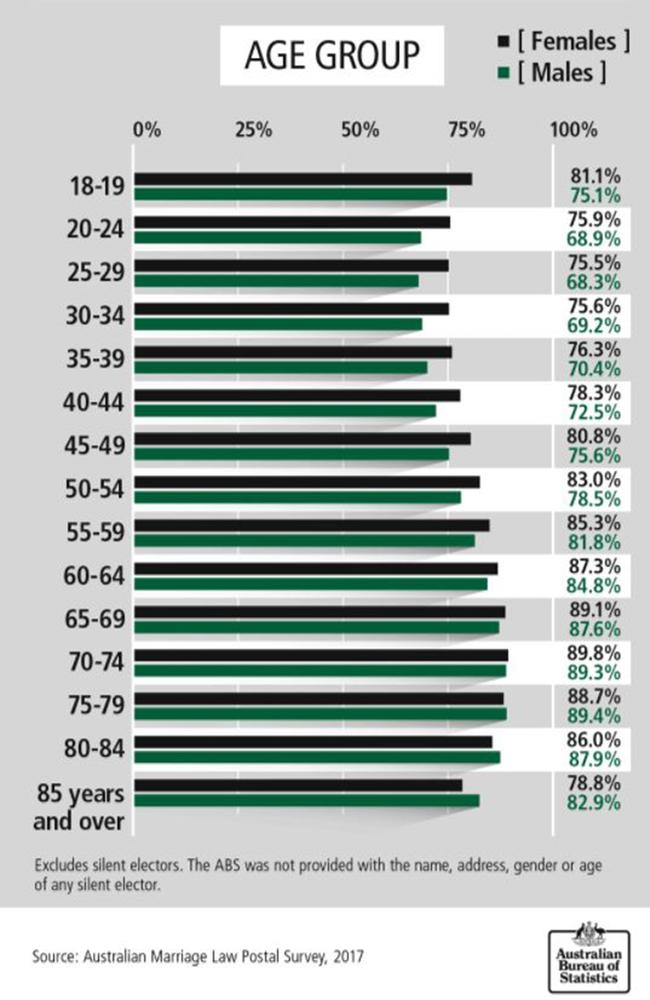
All age groups had higher than 70 per cent participation, with older voters having a slightly higher turnout.
Those aged 70 to 74 were the most likely to respond to the survey, with 89.6 per cent of eligible Australians in this age group voting. The participation rate was lowest among those aged 25 to 29 at 71.9 per cent.
But the youngest group of eligible Australians (aged 18-19 years) were more likely (78.2 per cent) to participate than any other age group under the age of 45.
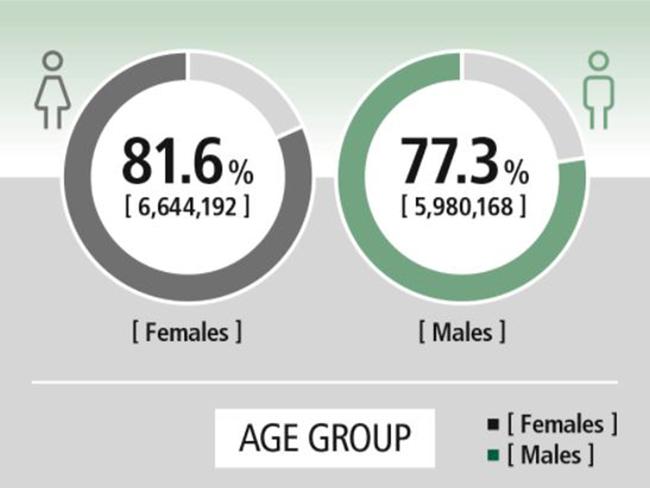
More women participated than men, with 81.6 per cent (6,644,192) of eligible females and 77.3 per cent (5,980,168) of eligible males participating in the survey.
Participation by state was highest in the ACT, which had an 82.4 per cent turnout, followed by Victoria on 81.7 per cent.
The NT had the lowest turnout at just 58.4 per cent.
See the full results on the ABS marriage survey website.
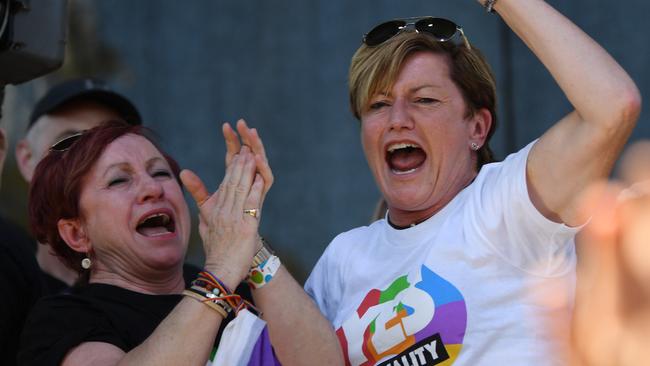
There were emotional scenes on the streets of Australia after the announcement, with the moment perfectly encapsulated by Labor senator and same-sex marriage campaigner Penny Wong, who was seen breaking down as the vote was announced. Social media peaked at 3853 tweets per minute.
Mr Abbott took to Facebook to “thank the 4.7 million Australians who supported marriage between a man and a woman”.
The Coalition for Marriage vowed to “continue defending parents’ rights, and fighting for freedom of speech and freedom of belief.”
“While we are naturally disappointed in today’s result, we accept and respect the decision of the Australian people,” said spokesman Lyle Shelton.
Conservative South Australian senator leader Cory Bernardi also voiced his disappointment, but said he was proud of the No campaign team and “together we can find a better way”.
But the mood was overwhelmingly jubilant, with Labor leader Bill Shorten tweeting, “YES!!” and celebrities including Kylie Minogue, Delta Goodrem and Ian Thorpe sharing messages of joy and good wishes.
“They have spoken in their millions and they have voted overwhelmingly Yes for marriage equality. They voted yes for fairness, yes for commitment, yes for love,” said Mr Turnbull.
“I know that many people, a minority, obviously, voted No. But we are a fair nation. There is nothing more Australian than a fair go, than a equality and mutual respect.
“Now it is up to us here in the parliament of Australia to get on with it, to get on with the job the Australian people have tasked asked to do and get this done. This year, before Christmas - that must be our commitment.”
Originally published as Why NSW had most marginal Yes vote of any state
Putin to ban gay marriage in constitution
President Vladimir Putin wants to insert a ban on same-sex marriage into Russia’s constitution, saying it’s his “duty” to stop gay people getting married.
Daughter backs dad dating ‘ex-boyfriend’
The daughter of one of Britain’s “first gay dads” has spoken out about why she is happy that her father has found love with her “ex-boyfriend”.