
Leader water ways special: Thomson, Dartmouth Dam, Hume dam, cairn curran reservoir
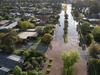
These amazing exclusive images show how much our dams have changed, from the ‘Millennium Drought’ of the 2000s to the devastating floods of 2022.
North West
Don't miss out on the headlines from North West. Followed categories will be added to My News.
The floods that ravaged large swaths of Victoria, claiming lives and causing widespread damage also set records, leaving dams close to — and in some cases exceeding — capacity.
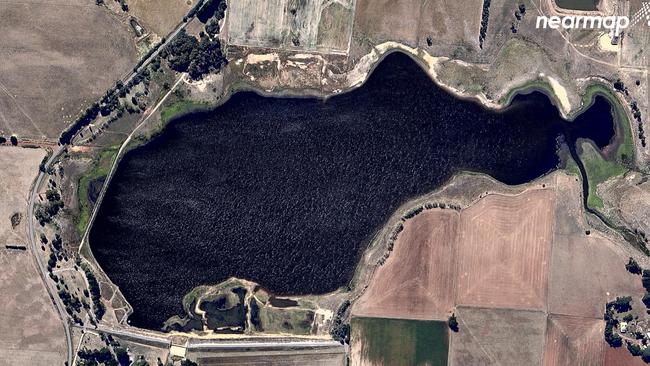
Dramatic photos provided exclusively to the Herald Sun by location intelligence company Nearmap show how dams, significantly reduced in capacity by the long years of the ‘Millennium Drought’, were bolstered by the heavy spring rains of 2022.
The deluge led to Melbourne Water reporting storage levels were at more than 98 per cent capacity on average — the highest level since 1996 and a 10 per cent increase from last year.
It also led to an unwelcome record, with the SES notching up one of the busiest months in its history, responding to 13,705 requests for help.
Bureau of Meteorology senior climatologist Jonathan Pollock said the October deluge had contributed to the wettest spring on record.
“It’s been a very wet spring, breaking some long-standing records, with all the rainfall and extra cloud the temperatures were a lot cooler than usual,” Mr Pollock said.
The heavy downpours have also forced authorities to manage storage levels, Goulburn Murray Water incident and recovery general manager Peter Clydesdale said.
“Most of our storages are fixed crest spillways. We have limited ability to manage floods at these storages; instead, they simply reach capacity then begin spilling,’’ he said.
“Fixed crest storages do, however, provide a significant reduction in flood peaks as flows pass through.
“Flood management is a lot more active at our gated storages — such as Lake Eildon and Cairn Curran Reservoir — where we can pre-release water to make room for further inflows. This ensures the flows out of the storages are less than the flows coming in.”
Greater Western Water’s managing director Maree Lang said water levels were expected to remain high in 2023.
“While our storages continue to remain high, we can’t take water storage levels for granted,’’ she said
“The amount of water we have available can vary depending on a range of factors including customer water use, climate conditions and population growth.
“By planning now for new water supplies and continuing to strive for efficient water use, we will be better prepared for the future.”
Today’s levels stand in stark contrast to the conditions of more than 10 years ago as the state’s major water catchments struggled with the Millennium Drought that ravaged the nation from the late 1990s to 2009.
Melbourne Water’s Chris Williams said in 2016 the state came close to recycling nearly a third of its wastewater to deal with the lack of water supply.
It took years to rebuild catchments with water experts warning, almost a decade on from the drought, that recovery was still underway, he said.
We’ve taken a look into Victoria’s biggest catchments across their feast and famine periods to provide an illustrative insight into the dramatic change using Nearmap imaging.
The Australian location intelligence company provides government organisations, architectural, construction and engineering firms, and other companies, with easy, instant access to high resolution aerial imagery, city-scale 3D content, artificial intelligence data sets, and geospatial tools to assist with urban planning, monitoring and development projects in Australia, New Zealand, and North America.
Thomson Dam
The Thomson’s lowest ebb came on July 1, 2009 as the dam’s storage lingered at 172.865GL — 16 per cent full. After the heavy downpour through October, Melbourne’s biggest dam reached its highest storage point of 1,082.781GL, above its 100 per cent capacity, on November 5.
Lake Buffalo
The lake was recorded at 16 per cent capacity on March 16, 2007. However, on November 5 of this year, Lake Buffalo had reached 68.6 capacity.
Waranga Basin
The basin has had a dramatic rise. On April 17, 2007, it was just 9 per cent full. On November 5, it was 95.3 per cent full.
Newlyn Reservoir
It was a perilous time for the Newlyn Reservoir in 2007. On April 26 of that rear, the reservoir was just 4 per cent full. On November 5 this year, it was at 101.9 per cent capacity.
Hepburns Lagoon
Perhaps the most significant change is at the Hepburns Lagoon. At one stage in 2008, it was almost bone dry — 0 per cent with a meagre 4ML in it.
Cairn Curran Reservoir
The reservoir was just 2 per cent capacity on May 2, 2007. On November 5 it recorded 94.7 per cent.
Tullaroop Reservoir
The reservoir reached a low point in 2009 at four per cent capacity on May 25, 2009. On November 5 it was over capacity at 102.7 per cent.
Laanecoorie Reservoir
The reservoir reached 82.6 per cent on November 5, a contrasting high point compared to 13 years prior, when the water storage was recorded at 4 per cent.
Kangaroo Lake
The lake was over capacity on November 5 at a recorded 102.1 per cent and had faired better than other dams in 2009. Official data shows it was at respectable 77 per cent.
Dartmouth Dam
The Dartmouth Dam went over capacity on November 5 at 101.6 per cent. Fifteen years ago, it was a different story, at 11 per cent capacity.
Lake Eppalock
Lake Eppalock’s lowest point came during the Millennium drought on May 28 in 2007. The lake was recorded at just two per cent full with 2231ML. The lake exceeded its capacity on November 5 as it reached 102.7 per cent.
HumeDam
The low point for the Hume Dam came on April 23, 2009, when it was just 2 per cent full. As of November 5, it was almost at capacity sitting at 99.6 per cent.
Lake William Hovell
Lake William Hovell fared better than some in the drought as it reached 23 per cent full on March 18, 2007. The lake was 103 per cent full on November 5.
Lake Eildon
The lake was 98.9 per cent full on November 5 but on April 30, 2007, it was just a meagre 5 per cent
Lake Nillahcootie
The lake went above its capacity on November 5 when it was recorded at 101.8 per cent full but in 2009, it was at just 11 per cent capacity.
Yarrawonga Weir and Goulburn Weir
It is important to note that the lowest volume for the weirs isn’t comparable with the upper catchment storages, as they are deliberately drawn down for maintenance or weed treatment.
The Goulburn Weir was 96.3 per cent full in November compared to 74 per cent in 2019 while the Yarrawonga Weir had reached 88.8 per cent on November 5 compared to the perilous 4 per cent recorded in 2009.

Join the conversation

‘Utterly devastated’: 102-year-old woman killed in fire tragedy
The 102-year-old woman killed in a tragic house fire has been remembered as a beloved neighbour who was the “character of the street” and “always smiling”.
Read more

NPL: Socceroo sacked as son scores wonder goal
TALKING POINTS: A fallen power of Australian football has axed its Socceroo coach, while his son scored an incredible goal for a rival club.
Read more