Coronavirus: How each state is tracking
Two weeks after the states and territories started implementing their own measures to control the outbreak of coronavirus, big differences are emerging in their rates of infection.
Coronavirus
Don't miss out on the headlines from Coronavirus. Followed categories will be added to My News.
Two weeks after individual states started to implement their own measures to control the outbreak of coronavirus, NSW is home to just under half of the national caseload.
A fortnight ago, NSW was home to approximately 40 per cent of all cases nationally, but as of yesterday, its share was almost 46 per cent.
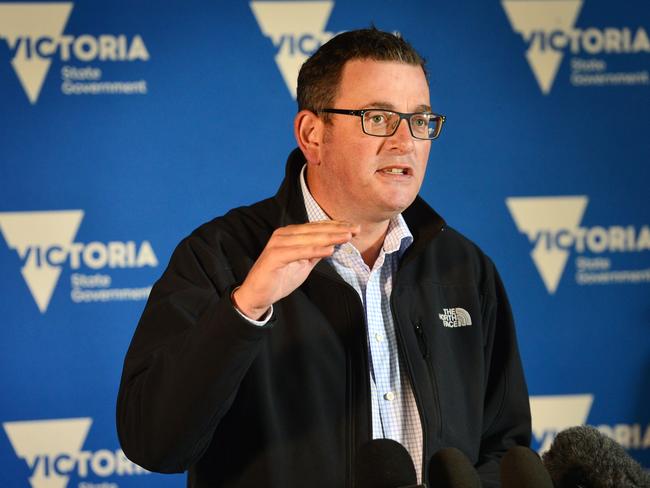
Victoria’s proportion of the national caseload has stayed steady at 20 per cent, while Queensland has decreased its share, from 19 to 16 per cent.
South Australia’s share of the national total has stayed steady at 7 per cent.
Epidemiologists believe NSW’s infection rates have been disproportionately impacted by the numbers of foreign arrivals, as well as by cases connected to cruise ships. (Of the 660 COVID-19 cases linked to the Ruby Princess debacle, more than half are in NSW.)
In the past week, cases of new infections increased by 32 per cent in NSW, 30 per cent in both Victoria and Western Australia, 35 per cent in SA and 37 per cent in Tasmania.
Queensland had the slowest rate of increase of any state over the past week, at just 24 per cent, but experts warn that could change once the rate of testing there picks up.
The Northern Territory saw a 100 per cent increase in infections over the past week, jumping from 14 on March 31 to 28 yesterday. Infections in the ACT have climbed 23 per cent in a week.
The effect of Victoria’s decision to go it alone and close schools on March 24 was not necessarily apparent in the infection rate data as yet, said virology professor Nigel McMillan of Griffith University.
“Queensland and Victoria had the same number of cases for quite some time and Victoria has gone a long way ahead, but they would have had high numbers of incoming international travellers,” he said.


“When Victoria closed their schools, the schools in Queensland were only about 25 per cent full anyway, because most parents voted with their feet. So it’s difficult to unpack.”
Epidemiologist Professor Mary-Louise McLaws from the University of NSW said it was the message behind the school closures, rather than the closures themselves, that may have had an impact.
“Rather than it doing anything about the spread, (the closing of schools) sent a really important social message that said you can’t congregate any more. I think that has improved Victoria’s numbers,” she said.
The amount of contact tracing each state and territory was able to do could also have a significant impact on the rate of new infections, she said. In NSW, an average of 48 people were being contacted after each positive test result, while in Queensland that number was 62 and in the Northern Territory it was 100, she said.

Professor McLaws suggested one of the reasons why NSW’s rate of infection was so high, and Queensland’s was relatively low, was in the differing number of outbreaks in aged care facilities. There have been 23 such outbreaks in NSW but only one in Queensland, she said.
“The proportion of people going into hospital in NSW [with COVID-19] is also much higher than in Queensland. Queensland’s rate is half that of NSW,” she added.
Queensland’s comparative success in controlling the virus to date may stem from “a lack of connectivity between returning travellers, the small number of elderly affected, and they haven’t had some of the cruise ship introduction,” Prof McLaws said.
All states and territories were benefiting from the decision to quarantine international arrivals for 14 days, Prof McMillan said, but he didn’t know exactly why Queensland was doing better than other states.
“We were slow to shut schools. We were slow to shut borders, so that’s not the reason,” he said.
“It may just be we had a lot more international cases coming in, and now those numbers are cut off, so the numbers are reflected that way. But I don’t have a good explanation.”
Queensland’s climate and diffuse population spread have been suggested as factors why the virus has not taken a greater hold in the Sunshine State, but Prof McMillan pointed out examples that seem to contradict those theories.
“Look at Iran – they have plenty of sunshine and plenty of cases. We know sunshine works great on all viruses but I don’t think it’s going to be responsible for those change in numbers at this stage at all,” he said.
“And we know the more crowded you are, the easier it is for the virus to spread. But if you think about countries that are highly dense like Singapore and Taiwan, their numbers are quite low, so it’s not the answer to everything.”
Prof McMillan also suggested Queensland’s infection rate could be set to change, with expanded peramaters for testing just announced.
“I think (Queensland’s) numbers will jump just a little, just because we are going to identify those cases. Those cases were already there, we just didn’t know about them,” he said.
