AFL finals: Brisbane Lions v Port Adelaide qualifying final, stats which show Power must make history
Port Adelaide heads into September with high hopes, but some concerning statistics appear to show that one aspect of their game could hold them back from the ultimate glory.

AFL
Don't miss out on the headlines from AFL. Followed categories will be added to My News.
Port Adelaide will have to rewrite recent history if it is to claim this year’s premiership.
Every flag winner this century has ranked in the top six at the end of the minor round for fewest points conceded.
The Power was 12th in the competition in that statistic this season, coughing up 1906, an average of 82.9 per game.
It was the most of the eight finalists and more than three teams not playing in September (the Western Bulldogs, Geelong, Adelaide).
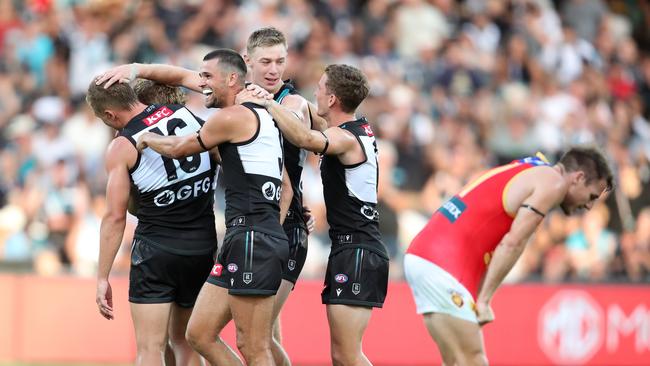
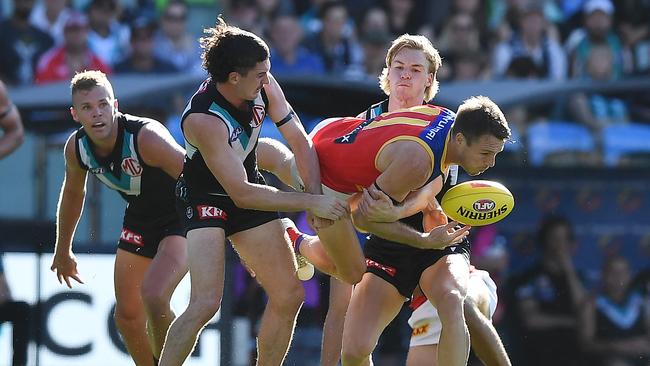
Port Adelaide finished third on the ladder with a 17-6 win-loss record to book a qualifying final against second-placed Brisbane at the Gabba next Saturday night.
Not since North Melbourne in 1999 has a premier been without one of the six stingiest defences in the league across the home-and-away season.

The Kangaroos were 10th for points against that year but finished second on the ladder at the end of the minor round and went on to win the flag.
Port Adelaide was much more miserly during its September tilts in 2020 and 2021, ranking first and third for fewest points conceded in those respective years.
Whether the Power can stifle an in-form Lions attack will go a long way to deciding the result at the Gabba.
Port’s defensive struggles – not just in its backline but across the ground – were pronounced late in the season, in a concerning trend for their premiership chances.
From rounds 18-24, when the team won three and lost four matches, Champion Data statistics showed Port ranked:
■ 14th for points against (averaging 88.9)
■ 17th for opposition scores per inside 50 (47 per cent)
■ 16th for contested possessions (averaging -10.1 per game)
■ 13th for opposition defensive 50 to inside 50 percentage (23 per cent)
■ 17th for opposition points from defensive half (37.9 per game)
Those seven games included a gritty two-point home loss to Collingwood, an undermanned 10-point road defeat to Geelong, a 51-point thumping of GWS at Adelaide Oval and a grinding, 16-point win over Fremantle in Perth, but also poor performances against Carlton (50-point loss) at Marvel Stadium and the Crows (47-point defeat), along with an indifferent home showing versus Richmond on Sunday (31-point victory).

Although it beat the Dockers and Tigers, Port conceded 52 inside 50s per game across the last two rounds – the 10th-most in the competition during that span.
Making next Saturday night’s test even sterner for the Power is that Brisbane’s attack has been one of the most potent in the league this year, ranking:
■ Second for points for (94.8 per game)
■ Second for points per inside 50 percentage (46 per cent)
■ First for points from turnovers (55.6 per game)
■ First for inside 50 differential (+8.8 per game)
■ Second for points from forward half intercepts (32.3 per game)
Add into the equation Brisbane’s imposing Gabba record, where it has won its past 12 games dating back to round 23 last season, and it is clear why the Power is a $2.75 underdog.
Ken Hinkley’s side is on a four-match losing streak against the Lions at the ground, winning there most recently in 2017.
One of the main things Port has going for it is its offence.

Particularly the ability to lock the ball in its forward half and score from stoppages.
Front-half, territory dominance helped propel the Power’s 2020 and 2021 finals charges.
This year, the club ranked:
■ Third for points for (averaging 93.4)
■ Fifth for scores per inside 50 percentage (46 per cent)
■ First in points from stoppages (39.5 per game)
■ Sixth for clearance differential (+1.8 per game)
■ First for time in forward half (+7:54 per game)
Port smashed Brisbane by 54 points at Adelaide Oval in round 1, their sole meeting this year.
How the Power and Lions’ 2023 statistical profiles translate in their crunch clash will be revealed next Saturday night.
But the past 24 years suggests Port will have to defy the odds if it to go all the way this September.
More Coverage
Originally published as AFL finals: Brisbane Lions v Port Adelaide qualifying final, stats which show Power must make history


