
Statistics that prove NRL penalty blitz is cleaning up 2018 season
NRL fans have called for the game’s referees to keep up their penalty blitz in a bid to clean up the game. And as coaches and commentators remain split on whether the crackdown is working - these are the numbers that prove it is.
NRL
Don't miss out on the headlines from NRL. Followed categories will be added to My News.
COACHES, commentators and players have been split on whether the increase in penalties to start the 2018 NRL season is ruining the game or making it better.
But fans are under no illusions as to whether the penalty crackdown should continue, with a whopping 93 per cent of respondents to a Daily Telegraph poll saying whistleblowers should hold firm.
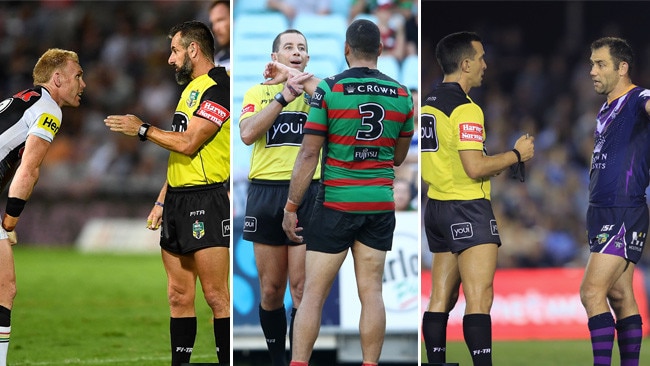
The issue came to a head on Friday night when 30 penalties were blown during the Sharks’ 14-4 win over the Storm — that’s one penalty every 2.5 minutes and the most penalties delivered during a match in the NRL era.
The Sharks-Storm clash smashed the previous record of 26 penalties set just two weeks earlier in Melbourne’s round two loss to the Wests Tigers.
One of the prevailing reasons for the Todd Greenberg-mandated penalty blitz was to eliminate the practice of clubs deliberately giving away penalties in a bid to reset their defensive line and frustrate teams on the attack.
And early indications — despite widespread criticism from commentators — are the NRL boss’ plan is working.
The game might have had a huge 583 penalties to start the season at an average of 18.22 penalties per game — again the highest in the NRL era — but Fox Sports Stats show that less teams who give away penalties are going on to win matches.
Just 31 per cent of clubs have lost the penalty count so far in 2018 but gone on to win the match.
Since 2012, between 40 and 47 per cent of clubs managed to claim victory in matches where they conceded more penalties than the losing side.
Such a substantial decline of 10 per cent or more is evidence the referees are winning the battle.
If clubs are giving away more penalties but going on to lose more matches then they will be forced to change tactics.
It’s already happening.
Cronulla backrower Luke Lewis told Triple M on Sunday the Sharks were already looking to change their behaviour based on the refereeing blitz.
And that’s what the NRL and fans are pushing for.
But there is more work to be done.
Fox Sports Stats reveal the Warriors are the worst offenders when it comes to giving away penalties in their own 20m, conceding 19 penalties in the red zone to start the season.
And yet Stephen Kearney’s side remain unbeaten after four rounds.
Three other current top eight teams — Rabbitohs (16 penalties), Roosters (15) and Storm (14) — have also been happy to give away red zone penalties.
But with premiership contenders the Roosters and Storm suffering some surprise losses to begin their 2018 campaigns the NRL’s message on player infringements might at least be hitting the mark.
Losses for the Warriors will come sooner or later if they continue down this path and, eventually, they too will begin falling into line.
Seeing so many penalties in NRL matches might be ugly to watch and it might frustrate the hell out of players, coaches, commentators and fans alike.
But it is working. More than 90 per cent of fans can see that and crunching the numbers backs the effectiveness of the blitz too.
*ALL FIGURES COURTESY OF FOX SPORTS STATS