Melbourne’s most undersupplied housing markets revealed as Victoria to fall way short of demand
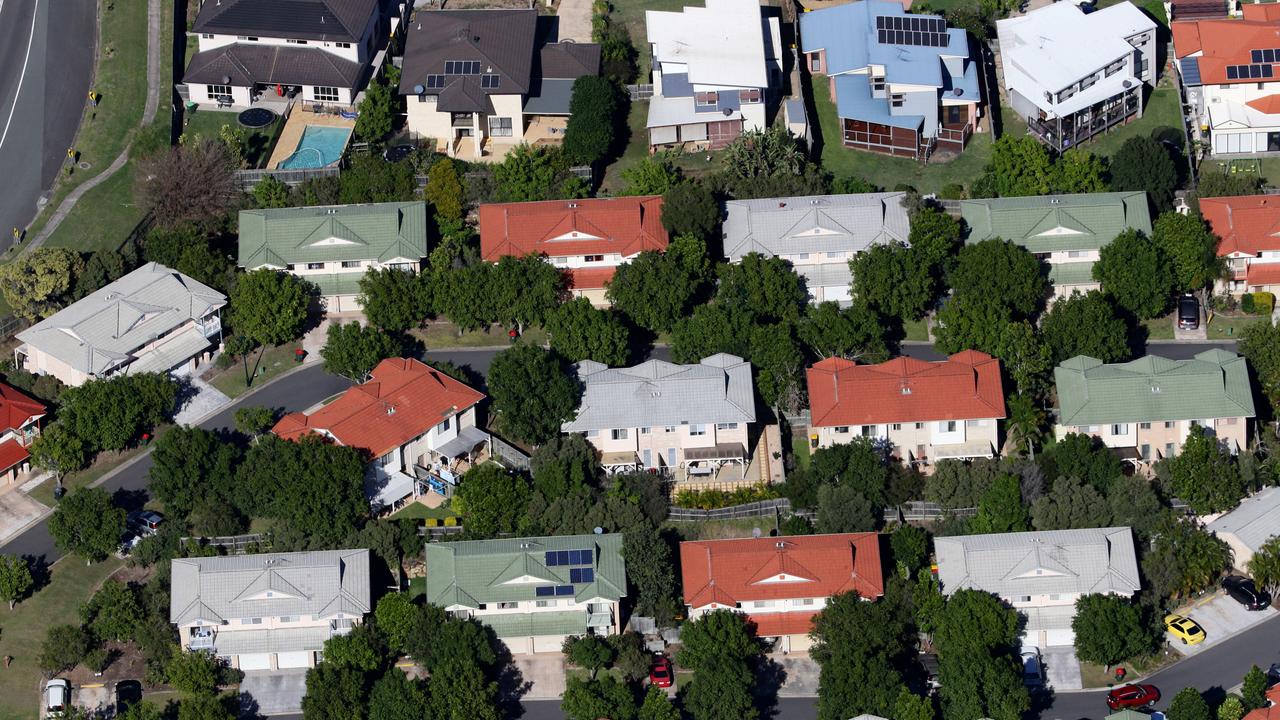
Victoria needs to build about 15,000 more homes than it typically does in a year to balance population growth and affordability — but alarmingly, numbers are set to fall.
Property
Don't miss out on the headlines from Property. Followed categories will be added to My News.
Victoria needs to build about 15,000 more homes than it typically does in a year to better balance population growth and affordability — but numbers are set to fall instead.
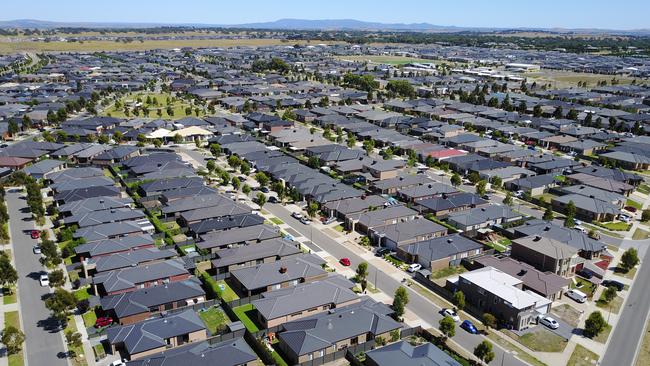
Housing affordability is set to worsen amid a perfect storm of pressures and new stock is unable to keep up with Melbourne’s swelling population, set to overtake Sydney’s in 2030.
Housing Industry Association chief economist Tim Reardon said interest rate rises and further amplified costs around new national building standards were making projects unfeasible.
RELATED: Melbourne property price falls stall in February, supply to be key factor in autumn
Melbourne suburbs where the most people are moving, and rents have increased most
Melbourne rentals: Listings beneath $400 per week halve in 12 months
“Victoria typically builds 60,000-70,000 dwellings a year, and then in 2024 we expect that to fall to just 52,000 homes due to rising interest rates and increased construction costs,” he said.
Australian Housing and Urban Research Institute managing director Dr Michael Fotheringham said there was “no magic number” the state needed to build to keep up with demand — but 20 per cent more would lead to “better housing affordability across the board”.
“In an ideal world Victoria would build 20 per cent more homes than they currently do and that would have an affordability outcome,” he said.
Dr Fotheringham said the type of housing being built needed to be focused on, as higher-end projects were skewed because they were more profitable, when what was most needed was more affordable housing.
And affordable apartments are first in line when it comes to abandonment by developers amid current pressures, according to PropTrack economist Anne Flaherty, with new houses and townhouses more profitable.
Economists say there is no way housing supply will keep up with demand this year, with Ray White’s Nerida Conisbee even suggesting Melburnians consider renting out their spare rooms.
“There’s a lack of properties, so trying to find a property to rent is challenging, but we know that there are a lot of spare bedrooms throughout Melbourne so that could be a potential way to help with students,” she said.
“Obviously it’s much more difficult to open up homes to people you don’t know but it would solve a problem we have right now. Rental costs are soaring and it’s because we just don’t have enough properties available.”
Ms Conisbee cited Study Gold Coast sending out letters to 55,000 Gold Coast families under Mayor Tom Tate’s letterhead asking them to consider taking on homestay students.
It comes as latest ABS figures show the number of private sector houses given the green light in Victoria slumped to 2570 in January — the lowest monthly number since 2557 were approved in October, 2019, and the second lowest since 2014.

Ms Flaherty said Melbourne and Sydney would be “hit hardest” by population growth, at the same time dwelling approvals dwindled, noting Melbourne would be the “fastest growing city in the country again over the next decade”.
“The cost of land is more expensive in Sydney and Melbourne and at the moment as well there are extremely high building and development costs and interest rates are really high so financing new developments is very expensive as well,” she said.
“Just because a project has approval to go ahead doesn’t mean it will over the short term. We’re hearing of more projects where cost of construction and time to build means they are not currently feasible, which means developers are actually shelving these projects.”
It comes as Melbourne’s most undersupplied housing markets are revealed, with the eastern suburbs dominating the top 20 analysis of Australian Bureau of Statistics and listings data.
The exclusive research from Suburbtrends shows where stock is tightest based on building approvals, sales inventory and listings, and vacancy rates.
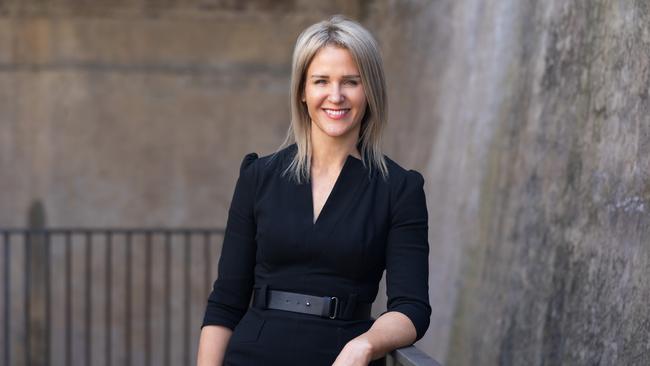
Suburbtrends founder Kent Lardner said undersupplied suburbs were tight for renters and buyers and “building approvals … over the past five years show there’s no let up in site”.
Ms Conisbee said areas where there was low development had the highest price growth consistently around Australia.
“So in Melbourne it is the eastern suburbs with the highest price growth over the longer term, and it’s predominantly because they don’t build as much housing,” she said.
“They’ve remained low density, there’s a lot of pushback to housing development so we don’t tend to see much high density being built, and we see high price growth as a result.”
MELBOURNE’S MOST UNDERSUPPLIED HOUSING MARKETS
Suburb, (SA3), Suburb Private Dwellings, SA3 Approval 5Y Count, SA3 Private Dwellings, SA3 5Y Approvals (%), Current Listings, Listings as a % of total private dwellings, Current Suburb House Inventory, Current Suburb Unit Inventory, Suburb Vacancy Rates
Wattle Glen, Nillumbik – Kinglake, 631, 1033, 23498, 4.40%, 10.16%, 1, 0, 0.0%
The Basin, Knox, 1624, 3739, 60407, 6.19%, 6, 0.37%, 1.56, 2, 0.0%
Chelsea Heights, Kingston, 2060, 3609, 52163, 6.92%, 8, 0.39%, 1.13, 0.8, 0.6%
Launching Place, Yarra Ranges, 901, 2917, 59147, 4.93%, 4, 0.44%, 2.4, 0, 0.0%
Taylors Lakes, Brimbank, 5174, 3290, 64908, 5.07%, 23, 0.44%, 2.11, 1.85, 1.4%
Eltham, Nillumbik – Kinglake, 6893, 1033, 23498, 4.40%, 32, 0.46%, 1.94, 1.63, 1.3%
Kew East, Boroondara, 2578, 5181, 70862, 7.31%, 12, 0.47%, 1.11, 2.48, 1.2%
Heathmont, Maroondah, 3759, 3376, 45549, 7.41%, 18, 0.48%, 1.22, 1.48, 0.9%
Rowville, Knox, 11863, 3739, 60407, 6.19%, 58, 0.49%, 1.51, 1.68, 1.3%
Croydon South, Maroondah, 1840, 3376, 45549, 7.41%, 9, 0.49%, 2.05, 1.41, 0.9%
Bayswater North, Maroondah, 3565, 3376, 45549, 7.41%, 18, 0.50%, 1.29, 1.2, 0.5%
Mitcham, Whitehorse – East, 6890, 1428, 24548, 5.82%, 35, 0.51%, 1.29, 1.94, 1.1%
Ashburton, Boroondara, 2943, 5181, 70862, 7.31%, 15, 0.51%, 1.37, 2.27, 0.8%
Diamond Creek, Nillumbik – Kinglake, 4288, 1033, 23498, 4.40%, 23, 0.54%, 2.18, 0.63, 0.0%
Cheltenham, Kingston, 10175, 3609, 52163, 6.92%, 56, 0.55%, 0.71, 2.29, 1.1%
Ferntree Gully, Knox, 10757, 3739, 60407, 6.19%, 60, 0.56%, 1.03, 1.98, 0.9%
Ringwood East, Maroondah, 4357, 3376, 45549, 7.41%, 25, 0.57%, 1.94, 1.08, 0.9%
Vermont, Whitehorse – East, 4022, 1428, 24548, 5.82%, 24, 0.60%, 1.71, 3, 0.9%
Chirnside Park, Yarra Ranges, 4264, 2917, 59147, 4.93%, 26, 0.61%, 1.98, 1.2, 1.1%
Badger Creek, Yarra Ranges, 646, 2917, 59147, 4.93%, 4, 0.62%, 1.6, 0, 0.0%
Source: SuburbTrends analysis of ABS data January 2018-December 2022
VACANCY RATES
Melbourne rental vacancy rate (all dwellings), monthly change, quarterly change, annual change, change since March 2020
1.41 per cent, -0.21 percentage points, -0.42 percentage points, -1.76 percentage points, -52 per cent
Regional Victoria rental vacancy rate (all dwellings), monthly change, quarterly change, annual change, change since March 2020
1.3 per cent, 0.08 percentage points, 0.27 percentage points, 0.37 percentage points, -28 per cent
Source: PropTrack, February 2023
Sign up to the Herald Sun Weekly Real Estate Update. Click here to get the latest Victorian property market news delivered direct to your inbox.
MORE: Where sellers made $1m+ profit in two years
$41m Hawthorn mansion boasts seven kitchens
Aussies urged ‘to be on their guard’ for unsolicited bank loan offers as cost of living bites
Originally published as Melbourne’s most undersupplied housing markets revealed as Victoria to fall way short of demand

