
Liverpool NAPLAN: 2019 Top performing primary schools revealed
An analysis of 2019 NAPLAN results has revealed the top performing primary schools in Liverpool, with just one government school making the top 10. See how your school performed.
Liverpool
Don't miss out on the headlines from Liverpool. Followed categories will be added to My News.
All but one of the top 10 performing primary schools in Liverpool, based on NAPLAN results, are independent or Catholic schools, new figures reveal.
An analysis of NAPLAN results from 2019 shows Holsworthy Public School was the only government school to rank among the top 10 schools in the region, with an average score of 490.1 based on student performances in Years 3 and 5.
It ranked sixth behind Green Valley Islamic College, St Joseph’s Catholic Primary School in Moorebank, William Carey Christian School in Prestons, Good Shepherd Catholic Primary School in Hoxton Park and St Christopher's Catholic Primary School in Holsworthy.
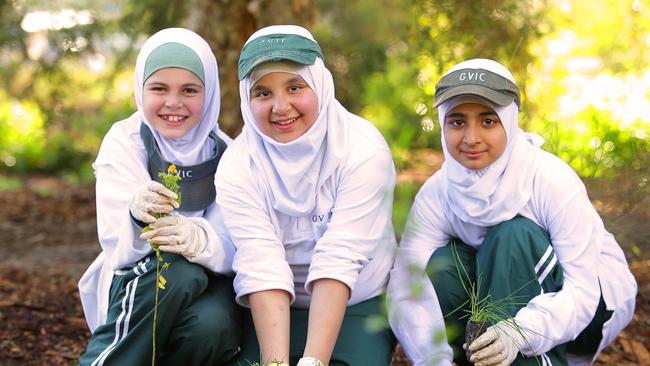
Years 3 and 5 students at Green Valley Islamic College scored an average of 511.5, pushing it to the top of the ladder.
College principal Mohammed Riaaz Ali said the school’s success was down to the “combined” efforts of students, parents and teachers.
“We have got quite a strong academic culture here at the school … and the expectations from the parents as well,” he said.
“Hard work and perseverance never goes unpaid and with our school our motto is to increase your knowledge.”
The school is focused on “quality learning”, which means going beyond minimum requirements, he said.
“Basically we do not try to water down any content. We try to encourage our students that they are equally capable.”
The school not only outlines expectations from the outset, but provides support to students so they can maximise their learning.
“In terms of the academic culture, we put our expectations really, really clearly when parents enrol their children at the school — what we need from the parents and children,” Mr Ali said.
“We also try to support our students in regards to their wellbeing and welfare as well.”
He said he was proud of the collective effort of the school community in producing excellent academic results.
“It’s not just luck — it’s in fact the hard work and perservance that goes on behind the scenes that many people don’t see.”
The NAPLAN test is designed to measure students in literacy and numeracy and track progress.
The NAPLAN test remains controversial with the Australian Curriculum, Assessment and Reporting Authority, the federal body responsible for developing national curriculum and assessment, this year revamping the MySchool website where school’s NAPLAN results are publicly displayed.
Focus groups across the country found MySchool was difficult to navigate and was filled with technical language and jargon.
ACARA also had to further explain on the website the benefits of NAPLAN and MySchool to parents.
HOW YOUR PRIMARY SCHOOL PERFORMED:
1. Green Valley Islamic College — 511.5
2. St Joseph’s Catholic Primary School — 494.7
3. William Carey Christian School — 491.6
4. Good Shepherd Catholic Primary School — 490.8
5. St Christopher’s Catholic Primary School — 490.7
6. Holsworthy Public School — 490.1
7. St Catherine of Siena Catholic Primary School — 488.3
8. St Francis Xavier’s Catholic Primary School — 487.3
9. St Mark’s Coptic Orthodox College — 486.5
10. St Francis Catholic College — 485.5
11. Newbridge Heights Public School — 482.5
12. Amity College — 482.4
13. Holy Spirit Catholic Primary School — 479.3
14. Unity Grammar College — 475.5
15. Al-Faisal College - Liverpool — 472.6
16. Thomas Hassall Anglican College — 472.2
17. All Saints Catholic Primary School — 471.3
18. Bardia Public School — 470.4
19. Wattle Grove Public School — 464.8
20. Christadelphian Heritage College Sydney — 464.3
21. Cecil Hills Public School — 459.8
22. Bellfield College — 458.7
23. Al Amanah College — 454.1
24. Chipping Norton Public School — 451.3
25. Greenway Park Public School — 450.5
26. Dalmeny Public School — 446.5
27. St Therese Catholic Primary School — 445.6
28. Warwick Farm Public School — 444.2
29. Hoxton Park Public School — 441.8
30. Hinchinbrook Public School — 441
31. Nuwarra Public School — 438.8
32. Marsden Road Public School — 438.6
33. Green Valley Public School — 437.6
34. Hammondville Public School — 432.3
35. Liverpool Public School — 431.2
36. Casula Public School — 430
37. Middleton Grange Public School — 429.4
38. Leppington Public School — 426.8
39. Cartwright Public School — 426.2
40. Kemps Creek Public School — 425.6
41. Austral Public School — 423
42. Prestons Public School — 417.7
43. Heckenberg Public School — 412.5
44. Bringelly Public School — 410.1
45. Sadleir Public School — 405.2
46. Liverpool West Public School — 401.5
47. Ashcroft Public School — 401
48. Busby Public School — 400.1
49. Busby West Public School — 396.4
50. Rossmore Public School — 384.6
51. Lurnea Public School — 383.7
52. Miller Public School — 362.9