
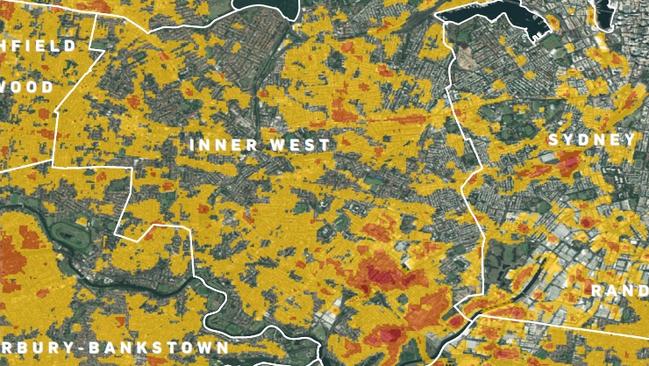
Sydney city heat map shows areas where temperatures rise due to urban heat island effect
Some of the hottest spots in NSW are in the city where the concrete jungle can cause temperatures to rise and remain above 13 degrees hotter than other places.
Central Sydney
Don't miss out on the headlines from Central Sydney. Followed categories will be added to My News.
Some of the hottest spots in NSW are in the city where the concrete jungle can cause temperatures to rise and remain above 13 degrees hotter than other places.
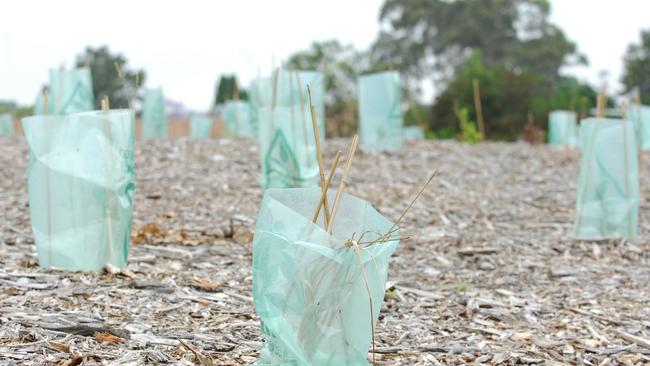
But the city of Sydney has had some of the best tree canopy gains in the country with 3.6 per cent more trees measured in 2016 than in 2009.
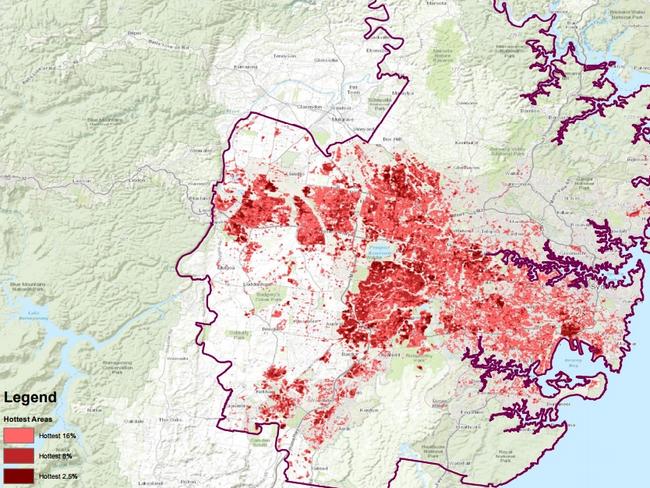
The Centre for Urban Research at RMIT University produced a report that calculated land surface temperature estimates from Landsat 8 satellite data that passed over each location about every 16 days between 8am and 10am during October 2015 and April 2016.
The urban heat island effect was estimated by measuring the difference in temperature between an urban and a corresponding non-urban area.
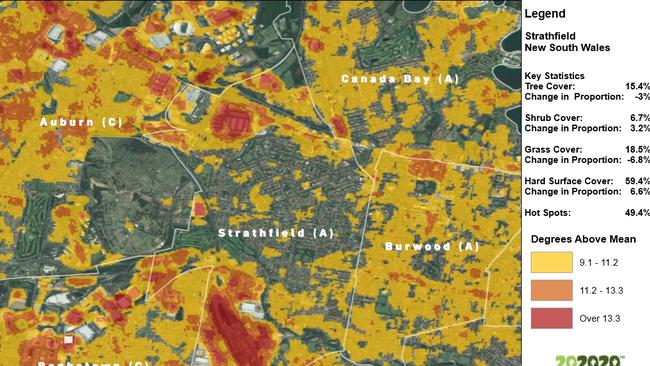
These measurements placed some areas of the city within the hottest 2.5 per cent of places in NSW and more than 13.3 degrees above the mean temperature.
Sydney Lord Mayor Clover Moore said trees are “our greatest weapon in the battle against the urban heat island effect”.
“We’ve committed to increase tree canopy cover in our area by 50 per cent on our 2008 baseline,” Cr Moore said. “Although we’ve planted 7,950 street trees since 2008, we face formidable challenges from major state infrastructure projects, particularly WestConnex.
“Although the NSW Government has committed to replanting trees, we face a difficult challenge in identifying space on public land to plant them.
“The inroad tree planting program will see the rollout to 27 new street trees along Ripon Way, Rosebery from next autumn.”
Nationally, tree canopy and shrub cover fell by 2.1 per cent in the past four years, equivalent to 161,860 Melbourne Cricket Grounds of urban green space.
Hornsby had the most shelter from trees in an urban area at 54 per cent.
The least canopy cover in an urban council area was 13.7 per cent in both the City of Botany Bay and Rockdale City Council areas.
In the Northern Territory, a heat mitigation study to see where Darwin’s hot spots are began in August 2017. Using a dedicated “energy bus” and drones to measure surface and air temperatures the study found streets, parking lots, roofs and pavements surface temperatures ranged from 45-67C.
“Areas such as the Post Office carpark, the Supreme Court car park, and the Bus Terminal are incredibly hot — Cavenagh Street (a CBD thoroughfare) is a river of fire,” Chief Minister Michael Gunner said at the time.
Tree canopy cover in Sydney:
2009 — 15.2 per cent
2016 — 18.8 per cent
Net — 3.6 per cent gain
Hard surfaces in Sydney City:
2009 — 69.1 per cent
2016 — 68.3 per cent
Net — 0.8 per cent decrease