
Revealed: Worst postcodes for home break and enters, thefts in NSW and greater Sydney
New figures have pinpointed the worst hot spots in NSW where crooks are targeting the most number of homes. Explore the list of which suburbs recording the highest rates of offending.

Central Sydney
Don't miss out on the headlines from Central Sydney. Followed categories will be added to My News.
New figures have pinpointed the worst suburbs in NSW – where thieves are targeting the most number of homes with some suburbs recording more than 500 incidents in the space of just one year.
The latest NSW Police data has revealed which suburbs homes are most likely to be targeted by crooks.
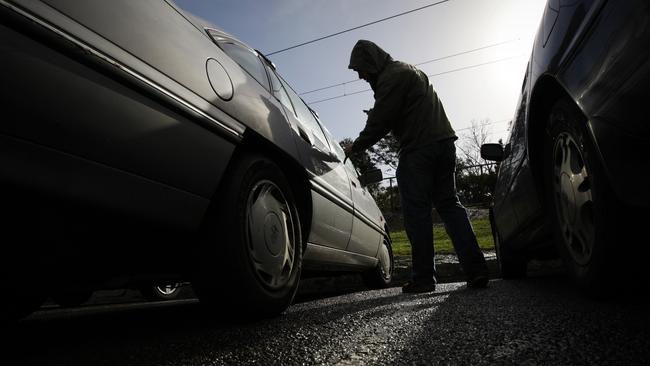
The data looks at six main crime categories – home break and enters, car thefts from homes, thefts from home, and home robberies with or without weapons.
In the past year there were 41,077 incidents across the six crime categories in NSW – an average of more than six offences every hour.
On a proportion of population, Bourke had the highest overall rate of offences for any postcode in NSW with 128 incidents in a town with a population of just 2389 people.
The rate of break ins in Bourke was 127 times higher than the rate for the state’s suburb with the lowest home theft rate – Cherrybrook, which recorded just eight incidents in a suburb home to 19,082 people.
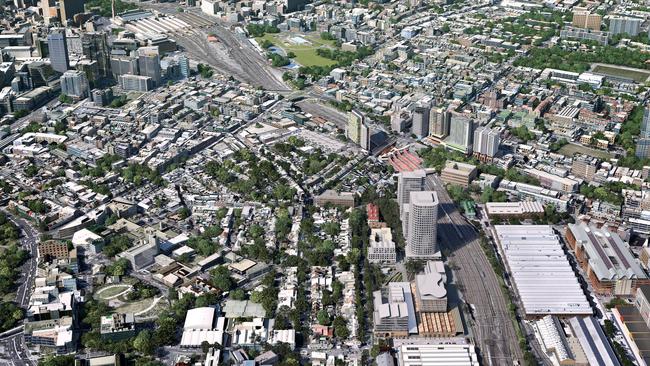
In Greater Sydney, Redfern had the highest overall rate of incidents based on population with 186 offences recorded across a 12 month period.
Mt Druitt had the overall highest number of incidents – recording 544 offences including 263 home break and enters – an average of more than five per week.
Auburn recorded the largest increase of incidents of thefts from homes between 2022 to 2023 – up 55 per cent – followed by Ashfield (up 44 per cent) and Manly (up 28 per cent).
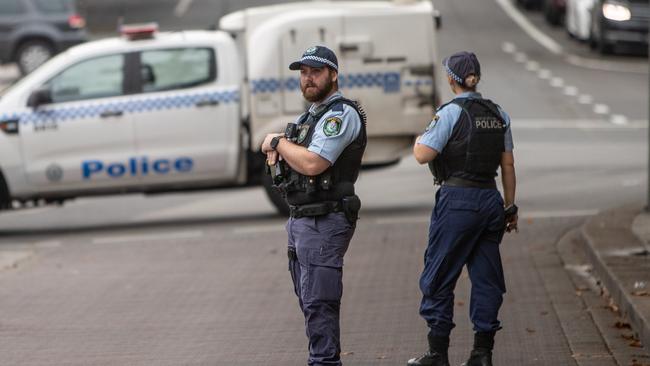
NSW Police said a large number of break and enter crimes are easily preventable by securing property.
Measures homeowners should consider include locking homes, ensuring all perimeter fences are in good order, and installing intruder alarms.
Below is a breakdown of the postcodes with the highest rates of offences using the most recent data from NSW Bureau of Crime Statistics which shows offences recorded in the 12 months to March this year.
GREATER SYDNEY
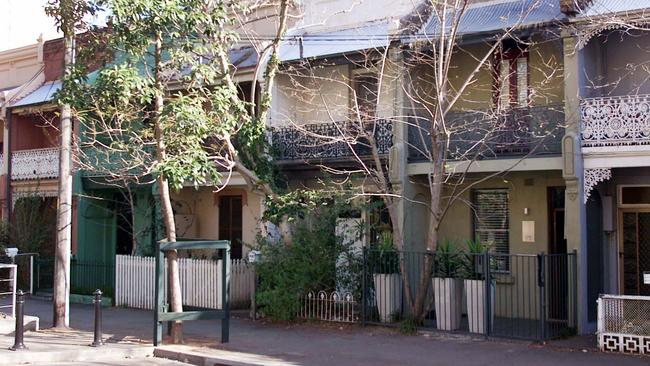
REDFERN
Redfern has topped the list of Sydney suburbs with the highest rate of thieves targeting homes with 186 incidents over the 12 month period. The incidents included 111 thefts from homes, 67 home break ins, and four cars stolen from homes. There were also three robberies with a weapon (not a firearm).
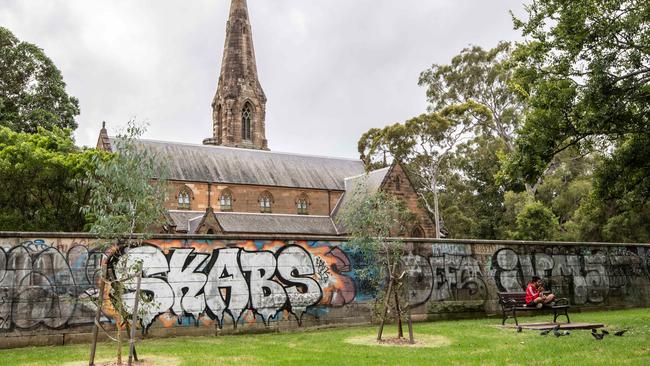
GLEBE
Glebe was another Sydney home theft hotspot – recording the second highest rate of incidents based on its population of 16,641 residents. The incidents included 73 home break and enters, 105 thefts from homes and eight cars stolen from homes. There was also one robbery with a weapon (not a firearm)
SURRY HILLS
Nearby Surry Hills recorded 267 incidents including 86 home break and enters over the 12 month period. There were also 170 thefts from homes, four cars stolen from homes and two robberies with a weapon (not a firearm). The suburb has a population of 26,443.
CLAYMORE
The southwest suburb of Claymore recorded high rates of home thefts based on its population of 2991 people. The incidents included 15 home break and enters, 11 thefts from homes and three cars stolen from homes.
WATERLOO
Waterloo clocked up 266 incidents in the 12 month period including 148 thefts from homes, 97 home break and enters and 15 cars stolen from homes. The suburb – which has a population of 29,003 people – also had four home robberies with a weapon (not a firearm) and one robbery with a firearm.
PARRAMATTA
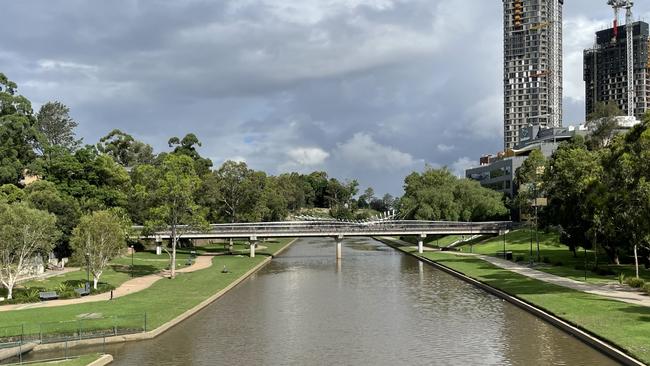
The fast-growing suburb of Parramatta recorded 323 incidents including 148 home break and enters – an average of almost three per week. The suburb of 35,254 people also had 154 thefts from homes, 17 cars stolen from homes and two home robberies with a weapon (not a firearm).
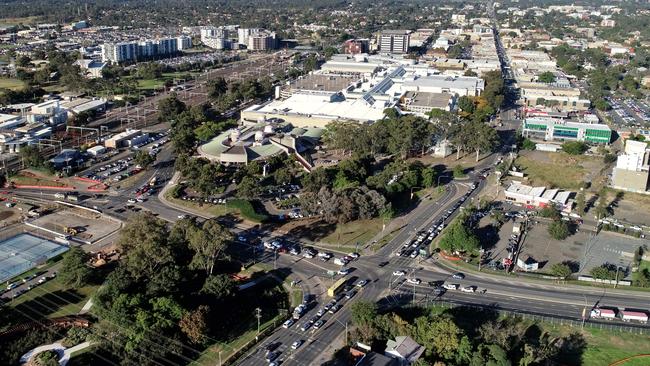
MOUNT DRUITT
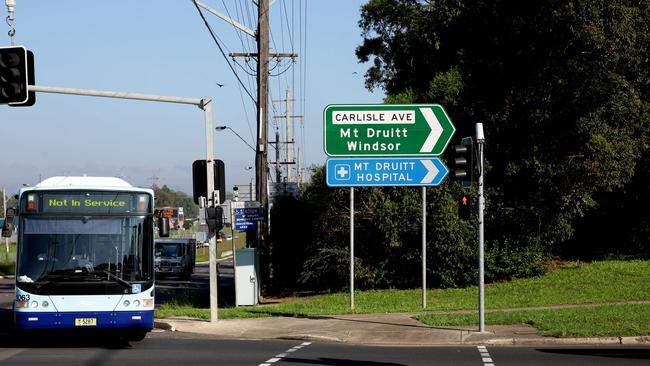
Mount Druitt recorded Sydney’s highest overall number of home theft incidents with 544 across a 12 month period. The incidents included 263 home break and enters, 194 thefts from homes and 77 cars stolen from home. The postcode – which has a population of 61,494 people – also had one home robbery with a firearm and three home robberies with a weapon (not a firearm)
GRANVILLE
Granville ranked next on the list with 240 incidents over the 12 month period. The figure included 84 home break and enters, 143 thefts from homes and 13 cars stolen from homes.
ULTIMO
Ultimo was another inner city hotspot for home thefts with 62 incidents based on its population of 7410 people. The incidents included 44 thefts from homes, 16 home break and enters and two cars stolen from homes.
VILLAWOOD
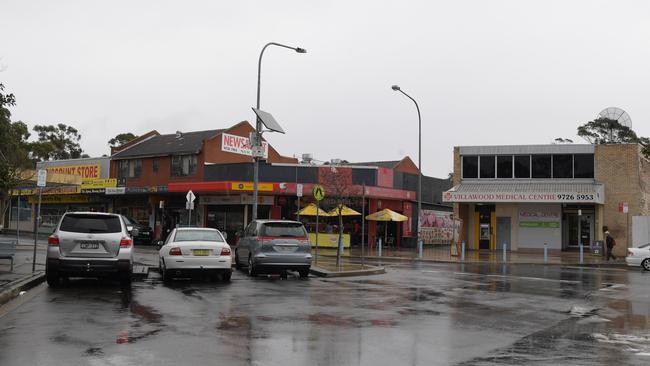
Villawood recorded 86 incidents across a 12 month period including 45 home break and enters, 28 thefts from homes, and 10 cars stolen from homes. The postcode of 10,544 people also recorded one home robbery with a weapon (not a firearm).
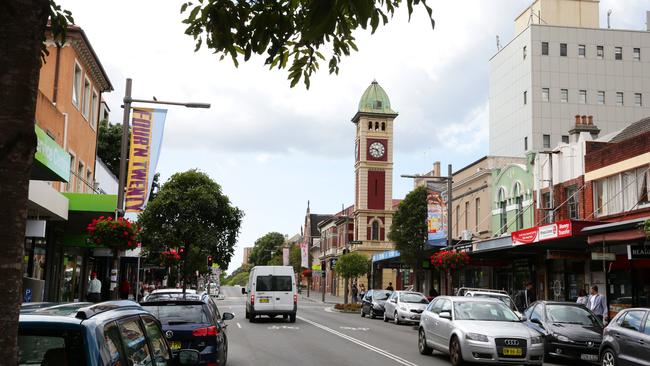
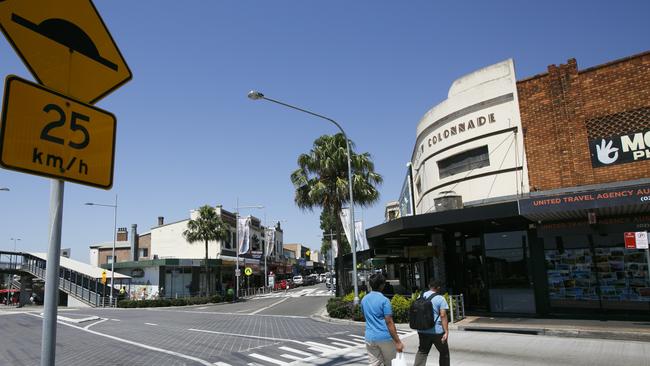
BURWOOD
The inner west suburb of Burwood had 146 incidents including 55 home break and enter offences. The incidents also included 55 thefts from homes, 11 cars stolen from homes, and one home robbery with a weapon (not a firearm). The postcode has a population of 18,224 people.
PENRITH
Penrith had 379 incidents across the 12 month period – the third overall highest number of incidents in the Sydney region. The number of incidents included 185 home break and enters, 142 thefts from homes and 49 cars stolen from homes. There were also two robberies from homes with a weapon, and one home robbery with a weapon (not a firearm). The postcode has a population of 49,204 people.
CAMPERDOWN
Camperdown ranked next on the list with 71 incidents across the 12 month period. The figure includes 19 home break and enters, 49 thefts from homes and one car stolen from a home. The postcode of 9381 residents also recorded one home robbery with a weapon (not a firearm).
ST MARYS
St Marys recorded 281 offences over the 12 month period including 119 home break and enters. There were also 115 thefts from homes, 42 cars stolen from homes, four home robberies (without a firearm) and one home robbery (without a weapon). The postcode has a population of 37,632 people.
TOONGABBIE
Home to 19,456 people, the Toongabbie postcode recorded 144 offences including 66 home break and enters and 62 thefts from homes. There were also 14 cars stolen from homes, one home robbery (without a firearm) and one home robbery without a weapon.
ALSO RANKED
The list of NSW postcodes rounding out the top 20 were Erskineville (67 incidents / population 9657), Homebush (144 incidents / population 20,766), Newtown (126 incidents / population 18,673), Doonside (156 incidents / population 23,384) and Chippendale (67 incidents / population 10,400).
REGIONAL NSW
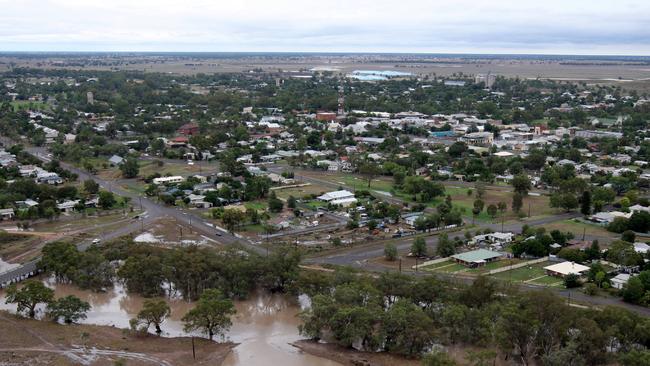
BOURKE
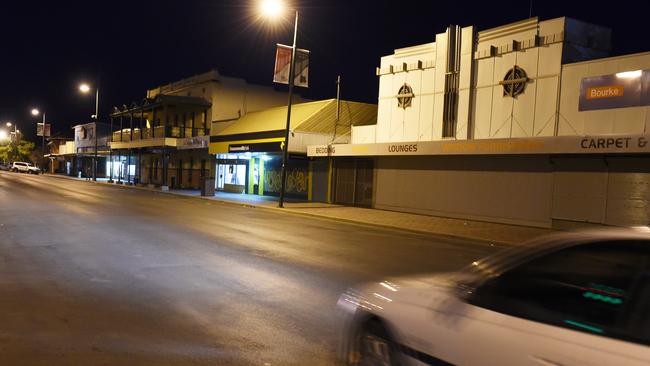
The outback town of Bourke topped the list for the state’s highest rate of break and enter and theft incidents from homes with 128 incidents recorded in the 12 month period. The postcode – which has a population of 2389 people – recorded 75 break and enters from homes, 24 cars stolen from homes, and 29 thefts from dwellings.
COONAMBLE
Home to 2965 people, Coonamble recorded 137 incidents including 98 home break and enters, 21 thefts from homes and 18 cars stolen from homes.
MOREE
The northwest town of Moree clocked up 363 incidents from a population of 9708 people including 202 home break and enters. There were also 66 thefts from homes, one home robbery with a weapon (not a firearm) and 93 cars stolen from homes.
CORAKI
The small town of Coraki, south of Lismore, recorded 87 incidents over the 12 month period including 52 home break and enters, 16 thefts from homes and 19 cars stolen from homes. The postcode has a population of 2821 people.
BREWARRINA
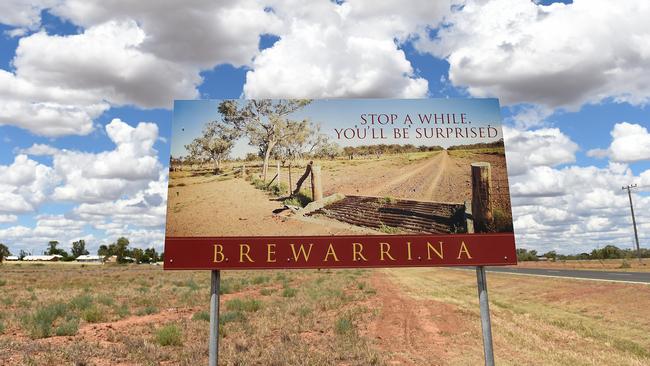
Brewarrina was another regional hotspot for offending with 20 home break and enters in a postcode home to just 1079 people. The postcode also recorded seven thefts from homes, five cars stolen from homes and one home robbery with a weapon (not a firearm).
CONDOBOLIN
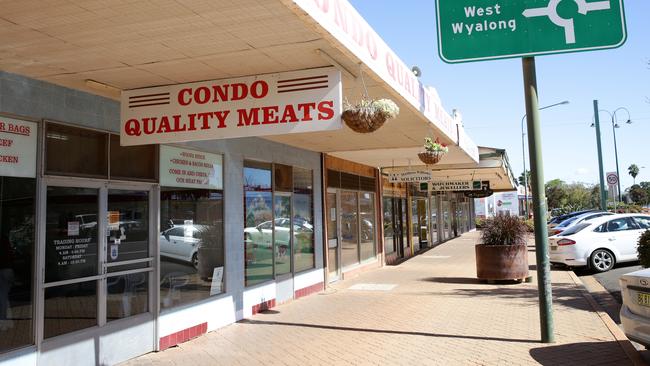
The central west township of Condobolin recorded 109 incidents including 55 home break and enters and 26 thefts from home. The postcode – which has a population of 3575 people – also had 27 cars stolen from homes and one home robbery (not a firearm).
WARREN
With a population of 2055 people, Warren recorded 48 offences over the 12 month period including 22 home break and enters, 15 thefts from homes and 11 cars stolen from homes.
KEMPSEY
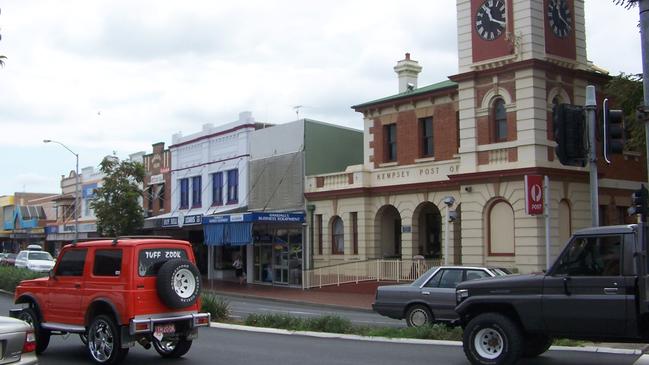
A popular pit-stop for motorists travelling the Pacific Hwy, the mid-north coast town of Kempsey is also popular among burglars with the postcode recording 532 offences in the 12 month period. The offences included 288 home break and enters, 143 thefts from homes, 98 cars stolen from homes, two home robberies (without a firearm) and one home robbery with a firearm. The postcode has a population of 23,166 people.
MEREWETHER
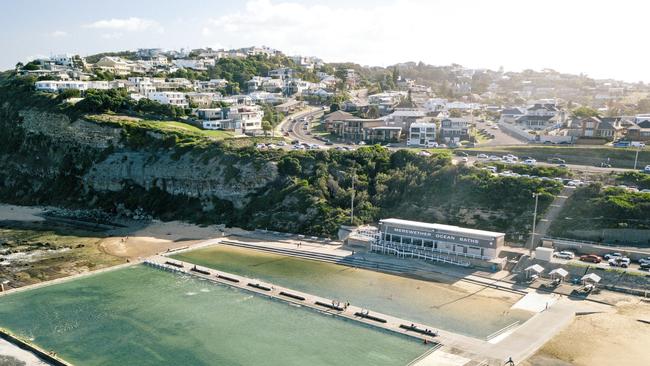
Picture-perfect Merewether was another regional hotspot for offending with the postcode of 14,279 people clocking up 293 incidents over the 12 month period. The figure included 175 home break and enters, 65 thefts from homes, and 53 cars stolen from homes.
HAMILTON
The nearby suburb of Hamilton was next on the list with the postcode of 9710 people recorded 197 incidents over the 12 month period including 109 home break and enters. There were also 18 cars stolen from homes, 68 thefts from homes, one home robbery with a firearm, and one home robbery without a weapon.
ALSO RANKED
The list of regional NSW postcodes rounding out the top 20 were Newcastle West (28 incidents / population 1411), Gunnedah (207 incidents / population 11,118), Hamilton North (2622 incidents / population 2622), Bogan (39 incidents / population 2202), Dubbo (780 incidents / population 44,963), Windale (57 incidents / population 3421), Newcastle (200 incidents / population 12,058), Wickham (51 incidents / population 3302), Muswellbrook (212 incidents / population 13,795) and Tamworth (798 incidents / population 52,436).


Bodyslams, beer, biffo: Footy, wrestling collide at Henson Park
From the sister of an NRL star to some of the best trash talkers in the business, PWA’s signature wrestling chaos is back at Henson Park as part of the Beer Footy Food Festival.

‘Isolated lapse’: Injury prevention, health leader caught drink driving
A corporate injury prevention and health leader was caught drink driving in the eastern suburbs after a few wines.