
Mapped: Vaccination rates in your neighbourhood and across Australia
The federal government has released new data for vaccination rates in your area and across the nation. Click here to see Covid vaccine figures in our interactive map.


SA News
Don't miss out on the headlines from SA News. Followed categories will be added to My News.
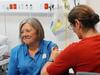
Want to know which SA area has the worst or best vaccination rate? What’s the worst vaccination rate? And how does your neighbourhood compare?
The federal government has updated vaccination data for every local government area in SA as well as the rest of our nation.
As of Tuesday, September 14, 42.60 per cent of Australians are fully vaccinated, while 67.8 per cent of people have had at least one dose.
In South Australia, 40.60 per cent are fully vaccinated and 1,439,865 jabs have been administered.
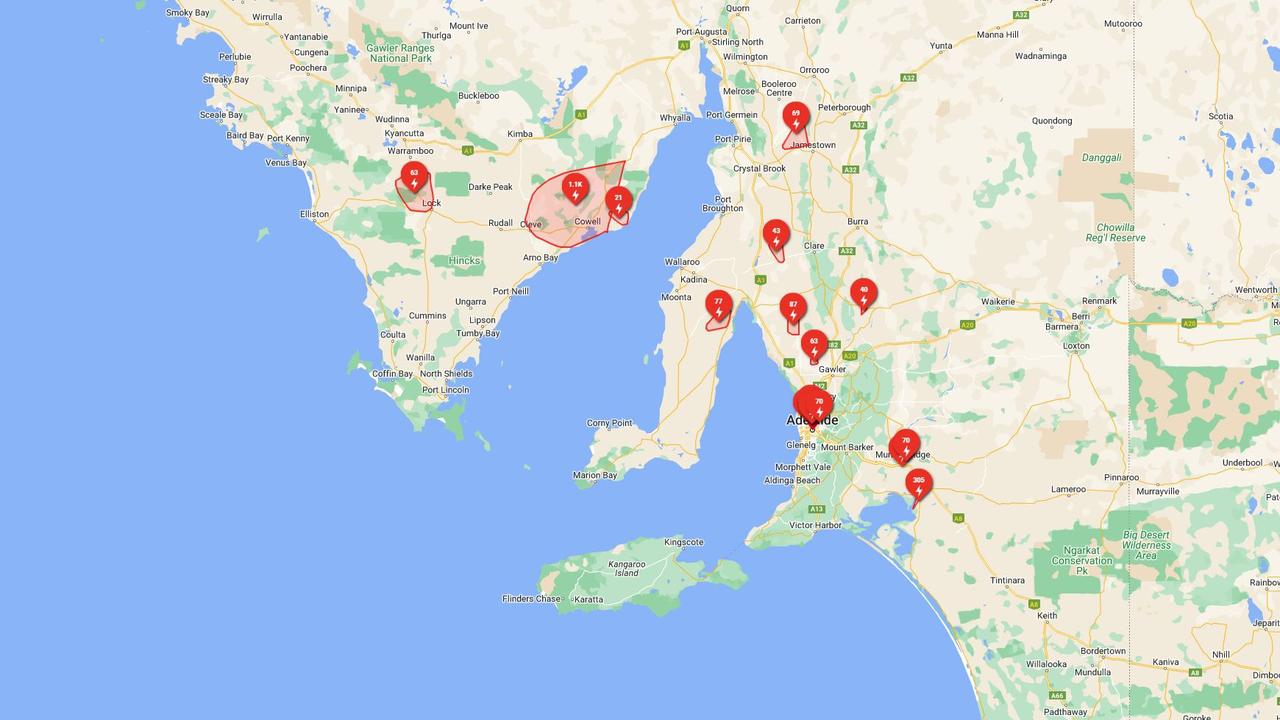
Here are two infographics showing vaccination rates among SA council areas and, below that, an Australian map to compare vaccine rates across the nation. (Please note these graphics may take several seconds to load).
Just 7.6 per cent of Grant residents are fully vaccinated as of September 14 the lowest rate in the nation
With this data it is important to note that eligibility and accessibility for vaccination would vary considerably by area and state depending on pockets of older populations and rollout rules for different regions.
EVERY SA COVID EXPOSURE AND TESTING SITE
More Coverage

Originally published as Mapped: Vaccination rates in your neighbourhood and across Australia
2700+ without power as SA swelters through hot, muggy night
Thousands of people had to endure an uncomfortable night without power after steady rain, thunder and wind gusts lashed large parts of the state – with more storms expected today.
Read more
Pedestrian fighting for life after being struck by truck
A woman, 29, has received critical injuries after she was hit by a truck in regional SA on Tuesday morning.
Read more