NAPLAN results the Illawarra: How every school performed in the Illawarra over last 5 years | List
We have crunched five years of NAPLAN results to bring you the ultimate list to the most and least improved schools from across the Illawarra. How does your school rate?
Schools Hub
Don't miss out on the headlines from Schools Hub. Followed categories will be added to My News.
An independent analysis of five years of NAPLAN results has revealed the schools that improved the most in the Illawarra.
The independent analysis, which compiled data from the Federal Government’s MySchool website, looked at scores from the Year 5 and Year 9 tests between 2014 and 2018.
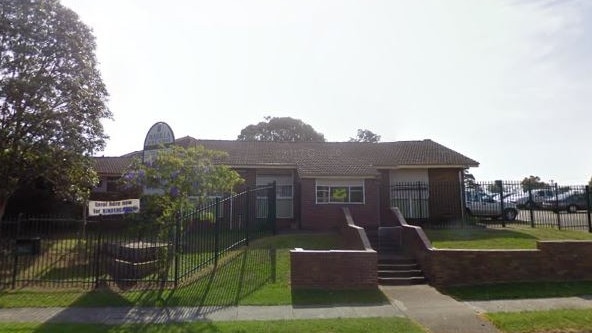
The most significant improvement in Year 5 results in the Illawarra region was at Warilla Public School, which improved its average results by 11.7 per cent across all subjects between 2014 and 2018.
To put these improvements into perspective, the average Year 5 improvement percentage across the state was only 0.42 per cent, and just 0.07 per cent in the Illawarra, with 58 schools in the Illawarra registering decreasing scores.

Warilla Public School’s most significant improvement was in reading which jumped an astounding 72 points, followed by spikes in grammar which increased 55 points, and writing and spelling, which both increased 43 points.
The region’s second biggest improvement in Year 5 results was at Kemblawarra Public School, in Port Kembla, which improved its average results by 10.5 per cent.
Kemblawarra’s strongest growth was in spelling, which climbed 62 points between 2014 and 2018, followed by reading which improved 41 points and writing and numeracy which both increased 39 points.
The third biggest improvement in Year 5 NAPLAN in the Illawarra was at Bellambi Public School, in Bellambi, where results increased 8.61 per cent across the five-year period.
Bellambi Public’s School’s greatest improvement was in grammar, which spiked 55 points between 2014 and 2018, followed closely by numeracy which improved 47 points, and reading which jumped 38 points.

Just a quarter of a per cent behind was Corrimal Public School, in Corrimal, which improved its average year 5 marks by 8.36 per cent across all subjects, placing them in fourth place in the Illawarra region.
Rounding out the Illawarra’s top five Year 5 schools was Callala Public School, which increased their average scores by 7.96 per cent in the same time period.
The region’s worst performing Year five NAPLAN school in terms of long-term improvement was Mogo Public School, which had a 15.20 per cent decrease in average results between 2014 and 2018.
Trailing not far behind were Lake Illawarra South Public School and Nowra Hill Public School, which produced score decreases of 9.80 per cent and 7.21 per cent respectively.
Top of the class for Year 9 improvement in the Illawarra was St Peter’s Anglican College, in Broulee, which improved its average results by 5.68 per cent across all subjects between 2014 and 2018.
The average Year 9 improvement percentage across the state was only 0.25 per cent, and 0.69 per cent across the Illawarra.
St Peter’s most significant improvement was in grammar, which improved by 42 points across the five years, followed by numeracy, which jumped 36 points and writing which jumped 31 points.
The region’s second biggest improvement in Year 9 results was at Woonona High School, in Woonona, which improved its average results by 4.56 per cent.
The testing area where Woonona High produced their greatest improvement was writing which increased by 33 points across the five years, followed by writing which spiked 33 points and numeracy which improved by 27 points.
The third largest improvement in the Illawarra was at Warilla High School which improved their year nine results by 3.648 per cent.
The Year 9 students at Warilla improved their scores by 26 points in grammar, 21 points in writing and 20 points in reading.

Nabbing the spot for fourth best Year 9 NAPLAN improvement in the Illawarra was Shellharbour Anglican College, in Dunmore, which increased its average NAPLAN results by 3.647 per cent.
Long serving foundation head of Shellharbour Anglican College, Tony Cummings – who left the school this week after 16 years – said he was “delighted” with the results, but reiterated that the school “has done nothing specifically to achieve that outcome”.
“We don’t teach to NAPLAN,” Mr Cummings said. “We do use it as a diagnostic tool, but if I could legally get away without never advertising our NAPLAN results I would, because that is not the purpose of NAPLAN,” he continued.
Mr Cummings said he “despairs” the way NAPLAN results have been leveraged by schools for advertising, and was “disappointed” that this has become NAPLAN’s purpose.
Improvements in Year 9 NAPLAN at Shellharbour Anglican College have been a by-product of preparing students for “lifelong learning” and the “extraordinary culture” at the college, two things Mr Cummings is proud to leave behind as part of his legacy, which he said were “more important than results”.
“We have in the last three to four years developed what I think is a very rigorous teaching and learning framework which prepares students for lifelong learning in this century. The fact that this is achieving an improvement (in NAPLAN) is a nice consequence,” Mr Cummings said.
He said the school engaged in two years of consultation before developing their current learning framework internally, allowing the school’s teaching to “reflect the needs of students” and support them “when they leave school and go into tertiary studies or employment”.
The top five Year 9 improvers was rounded out by Edmund Rice College, in West Wollongong, which saw an improvement of 3.33 per cent.
The region’s worst performing Year 9 NAPLAN school in terms of long-term improvement was a government school, Moruya High School, which had a 2.6 per cent decrease in average results between 2014 and 2018.
An independent school produced the next worst improvement in the Illawarra – St Mary Star of the Sea College, in Wollongong – which experienced a 2.4 per cent decrease in NAPLAN scores over the five years.
Special schools, schools with fewer than 20 students enrolled in either year, and schools that did not report any results for NAPLAN subjects in either year were excluded from the analysis.
Illawarra’s top 10 Year 5 NAPLAN improvers over five years were:
1. Warilla Public School: 11.7 per cent
2. Kemblawarra Public School: 10.5 per cent
3. Bellambi Public School: 8.6 per cent
4. Corrimal Public School: 8.4 per cent
5. Callala Public School: 8.0 per cent
6. St Mary’s Star of the Sea Catholic Primary School: 7.5 per cent
7. Woonona Public School: 6.4 per cent
8. Nowra East Public School: 5.5 per cent
9. Albion Park Rail Public School: 5.3 per cent
10. St Paul’s Catholic Primary School: 5.2 per cent
Illawarra’s top 10 Year 9 NAPLAN improvers over five years were:
1. St Peter’s Anglican College – Broulee: 5.7 per cent
2. Woonona High School: 4.6 per cent
3. Warilla High School: 3.6 per cent
4. Shellharbour Anglican College: 3.6 per cent
5. Edmund Rice College: 3.3 per cent
6. Keira High School: 2.8 per cent
7. Elonera Montessori School: 2.6 per cent
8. Nowra Anglican College: 2.5 per cent
9. Calderwood Christian School: 2.2 per cent
10. St Joseph’s Catholic High School: 2.1 per cent
Illawarra’s bottom 10 Year 5 NAPLAN improvers over five years were:
1. Mogo Public School: -15.20
2. Lake Illawarra South Public School: -9.80
3. Nowra Hill Public School: -7.21
4. Culburra Public School: -6.35
5. Kiama Public School: -5.88
6. Lake Heights Public School: -5.75
7. Elonera Montessori School: -5.70
8. Tomerong Public School: -5.54
9. Corrimal East Public School: -5.51
10. Shoalhaven Heads Public School: -5.34
Illawarra’s bottom 10 Year 9 NAPLAN improvers over five years were:
1. Moruya High School: -2.64 per cent
2. St Mary Star of the Sea College: -2.47 per cent
3. Warrawong High School: -1.43 per cent
4. Lake Illawarra High School: -1.21 per cent
5. Kiama High School: -0.80 per cent
6. Carroll College: – 0.61 per cent
7. Shoalhaven High School: -0.38 per cent
8. Wollongong High School of the Performing Arts: -0.27 per cent
9. Oak Flats High School: -0.21 per cent
10. Holy Spirit College: -0.20 per cent
