
Logan updates flood mapping as fears rise over ‘improbable’ flood events affecting land values
Updated flood maps for Logan City have sparked anger from property owners who say the mapping is based on ‘improbable’ inundation events and will unfairly decrease land values.


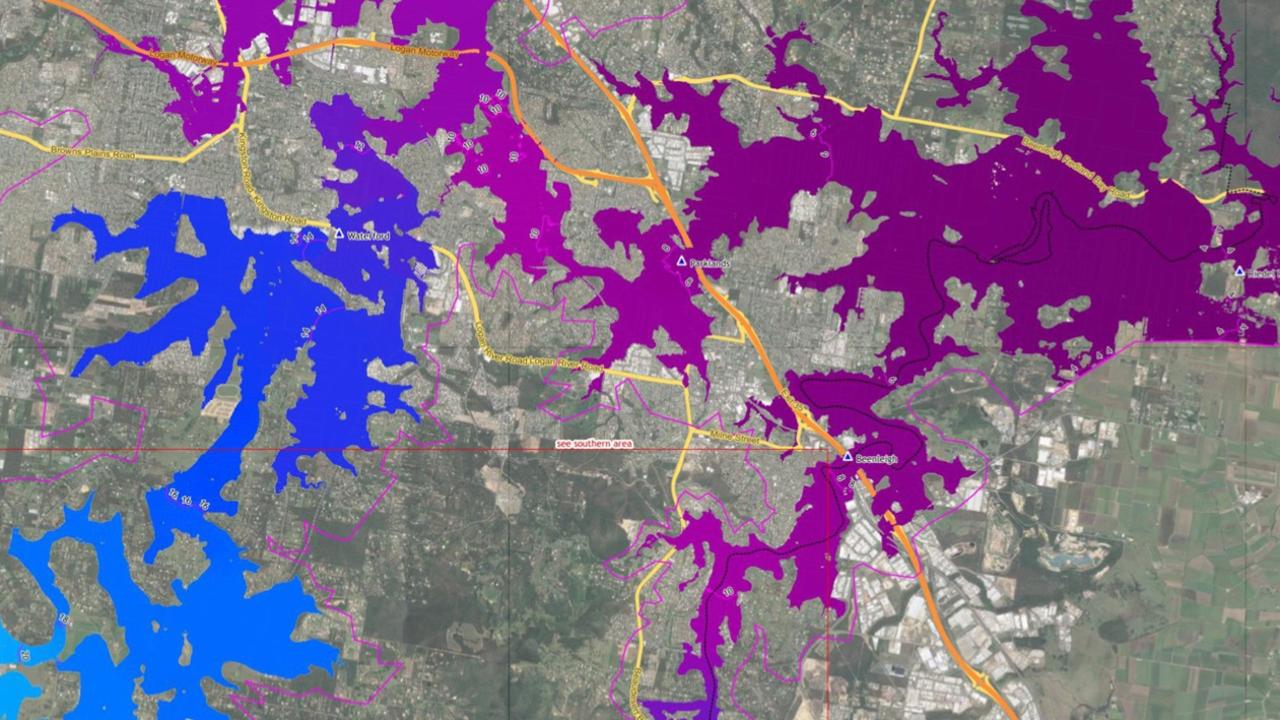
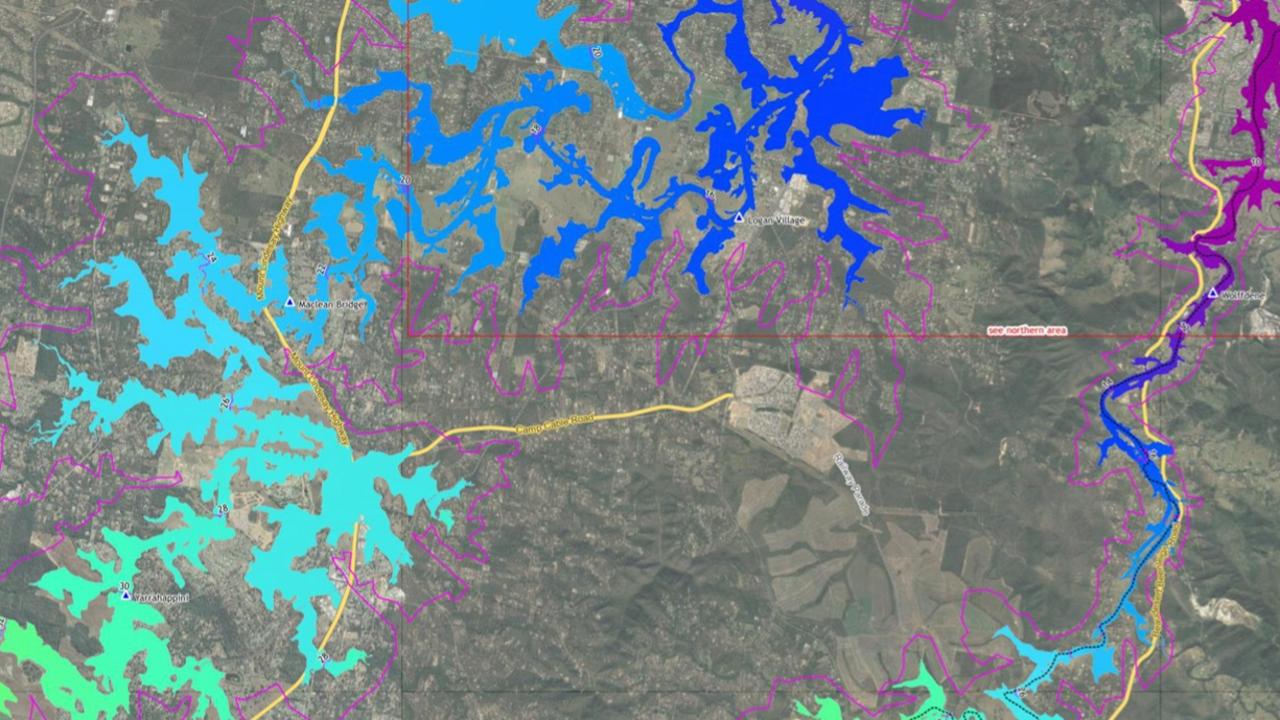
Logan residents have finally been given a glimpse of the lay of the land in their city after the local council published updated flood mapping, which has increased the area of land affected by inundation.
Hours after Logan City Council published the updated “maps”, residents expressed concerns that properties which had never flooded were now included and that there was no overall map to show the city’s major flooding zones.
Streets in parts of Beenleigh, Bethania, Eagleby, Jimboomba, Carbrook, Cornubia, Waterford and Kingston have been shown to flood in the updated flood maps.
Engineering and mapping company WRM Water & Environment spent more than a year compiling and researching the maps which depict a weather event that has a 1 per cent chance of happening, or a 1 in 100 chance, in any year.
The 254-page Logan and Albert Rivers Flood Study claims the maps are an annual probability guideline of the chances of a one-in-100-year flood event.
The document warns property owners that the data and maps do not guarantee the mapped flood event will actually occur once every 100 years.
There were 263 Logan homes inundated by riverine flooding in the February-March flood.
Jimboomba property owner Bec Huntley said her land, near Mitre 10, had never had water over it.
“I’m devastated because, as a single parent, I’m lucky to even have a house, but with insurance, rates, mortgage interest all going up, it’s already a struggle,” Ms Huntley said.
“But now to have a flood line over my property will see my property value plummet and my insurance skyrocket.
“I now have flooding marked on my land and two of my downhill neighbours are completely under.
“Another neighbour also now has flooding marked on the property where it was not there before.
“I think many property owners are upset because they face similar flooding costs.
“Our properties have been unaffected by flooding but now are worthless.”
Ms Huntley said she has owned her Jimboomba property for six years and was there during the 2017 Cyclone Debbie floods and the recent March event and was not flooded.
She said neighbours had lived in the street since the land was developed in the late 1980s and were present for the 1991 flood when they said Ms Huntley’s block did not flood.
Ms Huntley said she checked the council’s flood maps before purchasing the property and they showed floods were not close to her block.
She said she was concerned that prospective buyers would not consider her property because of the flood maps.

The new mapping includes two studies — one on the Albert and Logan Rivers and one on the Slacks Creek and Scrubby Creek catchments.
Analysis, which is presented with the hi-tech mapping, which takes about 20 hours to build a profile for each property, states that the maps do not depict the highest possible flood level that might affect a property, “as floods are highly unpredictable and variable”.
The flood levels were sourced from Logan City Council’s accepted flood studies and flood modelling and were measured in Australian Height Datum metres, where the mean sea level is approximately zero 0 metres.
The document also states that the data for the maps will be updated as more information becomes available and warns property owners and residents that the maps should not be used for development assessment purposes and were not substitutes for independent professional advice.
“You should engage the services of a registered professional engineer of Queensland to obtain site specific information regarding the flood risk to your property and any of the implications for any proposed building or development,” the document said.
Logan City Council was contacted for this story.
Its website said although the council took reasonable care in producing the report, it did not guarantee the information was accurate, complete, or current.
“Logan City Council does not accept any responsibility for any loss or damage in connection with the use of or reliance on the information in this report.”
Flood updates for Henderson Creek, Days Creek, Quinzeh Creek, Windaroo and Belivah Creek, Chambers Creek and Upper Oxley Creek will be made in 2023 and 2024.
The council is also preparing its new planning scheme which will incorporate updated flood information and best-practice flood mapping methods.


Fisherman reveals fight to haul in monster bull shark from SEQ river
