
Numbers Crunch: The players who stand out when your club wins — and loses
THEY are the barometers — the players that your club needs to play well to win. See which players Andrew Capel discovered must be running hot for your club to fire.

AFL
Don't miss out on the headlines from AFL. Followed categories will be added to My News.
THEY are the barometers — the players that your club needs to play well to win.
After 10 rounds of 2015 there has been a direct correlation between the performances of key players at each club in victories and defeats.
While it is only a small, mid-season sample size, Champion Data analysis highlights which players are often targeted by rivals, knowing how important they are to success and failure.
These players are not necessarily their team’s best player, although in several cases they are, but the ones who when they fire have the ability to lead their team to victory.
In contrast, when they struggle so do their sides.
Opposition clubs do their homework and, according to Champion Data, break down the statistics to determine who each team’s most influential players are.
They then employ tactics to shut them down, knowing how important their output is to a result.
Based purely on performances in wins and losses this season, captain Travis Boak is Port Adelaide’s kingpin.
He averages 113 rankings points in wins and only 87 in losses.
The midfield gamebreaker’s disposals, contested possessions, clearances and score involvements are all down when the Power loses, illustrating his importance to the team.
At Adelaide, midfielder Rory Sloane is the engine room difference maker.
While on-ball sidekick Patrick Dangerfield is regarded as the Crows’ best player, the influence Sloane has on the team is recognised in the barometer ratings.
He has the biggest differential between victories and defeats at Adelaide, recording 117 rankings points in wins and 65 in losses — a whopping 52-point swing.
Brett Deledio has long been regarded as Richmond’s barometer.
The stats show how important he is to the Tigers.
In wins the hardrunning utility averages 112 points and in losses he slumps to 60.
His score involvements almost half in defeats, from 7.6 a game to four.
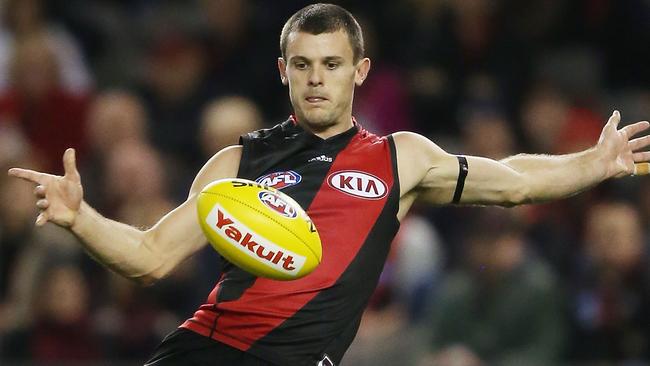
Essendon’s Brent Stanton has long been a target of rival clubs because of his influence when he is up and running and allowed space to run into.
When he cops a heavy tag he struggles and so do the Bombers.
He has a 26-point differential between Essendon’s wins and losses.
Not surprisingly, Geelong captain Joel Selwood, St Kilda skipper Nick Riewoldt, Hawthorn on-field leader Luke Hodge and gun West Coast forward Josh Kennedy all boast significant differentials when their team either wins or loses.
Several excitement machines — Collingwood’s Jamie Elliott, North Melbourne’s Jarrad Waite, Melbourne high-flyer Jeremy Howe and emerging Western Bulldogs star Jake Stringer — also feature prominently.
They have the ability to inspire their team-mates with brilliant individual deeds but can also drop off badly when things aren’t going their way.
Their win-loss differentials vary from -28 to -43.
Fremantle’s Danyle Pearce has been allowed to roam free since crossing from Port because of the Dockers’ plethora of stars.
But when the Dockers inside midfielders were shut down by Richmond at Subiaco on Friday night he did not get his usual supply of the footy and recorded a season-low 49 rankings points — down from his 94 point average in wins — and his side subsequently fell to its first loss of the season.
The stats make compelling reading.
THE BAROMETERS
ADELAIDE
RORY SLOANE
Wins Losses
Ranking Pts 117 65
Disposals 25.0 16.5
Cont Poss 14.2 9.5
Clearances 5.4 3.0
Score Involv 6.2 4.5
BRISBANE
MITCH ROBINSON
Wins Losses
Ranking Pts 96 71
Disposals 16.0 18.0
Cont Poss 9.0 6.4
Clearances 3.0 1.5
Score Involv 5.0 3.9
CARLTON
LACHIE HENDERSON
Wins Losses
Ranking Pts 114 59
Disposals 14 9.8
Marks 4.0 6.2
Marks I50 2.0 1.3
Goals 5.0 0.7
COLLINGWOOD
JAMIE ELLIOTT
Wins Losses
Ranking Pts 95 61
Disposals 14.3 12.7
Marks 6.5 6.0
Marks I50 3.0 1.3
Goals 3.2 0.7
ESSENDON
BRENT STANTON
Wins Losses
Ranking Pts 106 80
Disposals 25.8 22.2
Uncont Poss 19.0 15.2
Metres Gained 433 409
Score Involv 6.0 3.8
FREMANTLE
DANYLE PEARCE
Wins Losses
Ranking Pts 94 49
Disposals 22.4 13
Uncont Poss 16.4 7.0
Metres Gained 557 139
Score Involv 4.9 1.0
GEELONG
JOEL SELWOOD
Wins Losses
Ranking Pts 112 86
Disposals 25.6 23.0
Cont Poss 14.8 13.2
Clearances 8.0 6.6
Score Involv 8.0 5.6
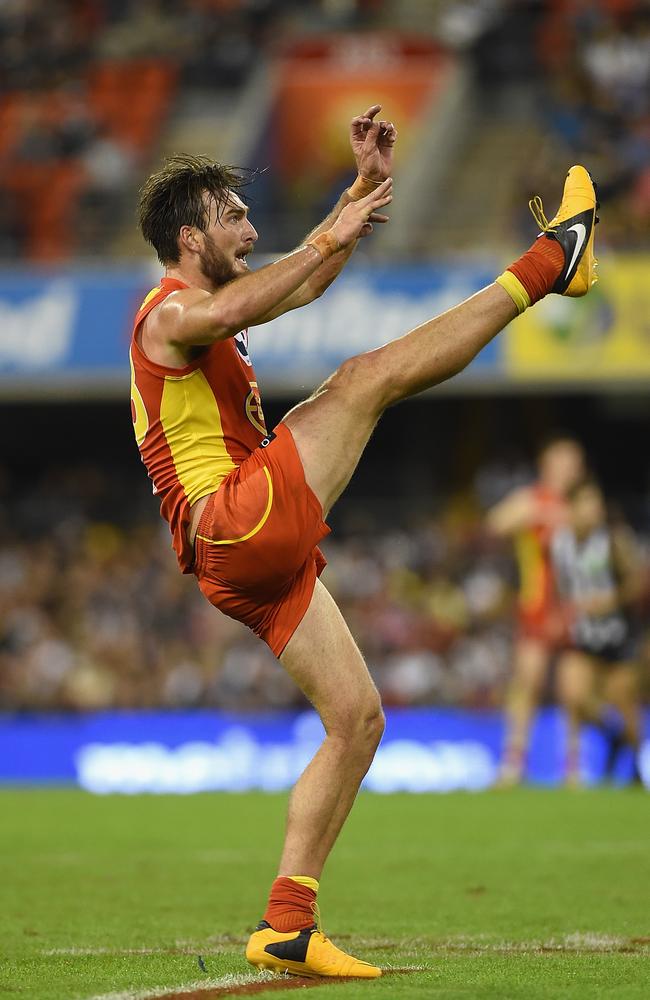
GOLD COAST
CHARLIE DIXON
Wins Losses
Ranking Pts 135 59
Disposals 19 8.2
Marks 7 3.6
Marks I50 4 2.8
Goals 6 2.2
GWS
ADAM TRELOAR
Wins Losses
Ranking Pts 117 77
Disposals 29.1 24.3
Cont Poss 11.3 8.3
Clearances 4.1 3.3
Score Involv 9.1 5.0
HAWTHORN
LUKE HODGE
Wins Losses
Ranking Pts 120 80
Disposals 29.4 29.0
Uncont Poss 20.0 18.5
Clearances 5.4 4.0
Score Involv 8.4 6.5
MELBOURNE
JEREMY HOWE
Wins Losses
Ranking Pts 104 61
Disposals 19.0 12.3
Intercept Poss 6. 3 4.5
Intercept Marks 1.3 1.0
Rebound 50s 2.3 3.0
NORTH MELBOURNE
JARRAD WAITE
Wins Losses
Ranking Pts 92 50
Disposals 14.8 12.8
Marks 6.2 5.8
Marks I50 2.8 1.5
Goals 2.6 0.8
PORT ADELAIDE
TRAVIS BOAK
Wins Losses
Ranking Pts 113 87
Disposals 28.0 25.4
Cont Poss 14.6 10.6
Clearances 6.8 4.0
Score Involv 7.6 4.0
RICHMOND
BRETT DELEDIO
Wins Losses
Ranking Pts 112 60
Disposals 23.6 25.4
Uncont Poss 14.8 10.6
Metres Gained 282 210
Score Involv 7.6 4.0
ST KILDA
NICK RIEWOLDT
Wins Losses
Ranking Pts 101 67
Disposals 17.7 14.7
Marks 10.3 8.3
Marks I50 2.7 1.7
Goals 2.3 0.7
SYDNEY
KIEREN JACK
Wins Losses
Ranking Pts 108 66
Disposals 25.9 18.5
Cont Poss 12.8 5.5
Clearances 5.0 2.5
Score Involv 6.5 5.5
WEST COAST
JOSH KENNEDY
Wins Losses
Ranking Pts 117 72
Disposals 15.0 12.3
Marks 7.7 6.3
Marks I50 5.4 2.0
Goals 4.9 2.0
WESTERN BULLDOGS
JAKE STRINGER
Wins Losses
Ranking Pts 87 59
Disposals 13.8 11.4
Marks 3.5 3.0
Marks I50 2.3 1.6
Goals 3.0 1.6
THE NO: 41 - average rankings points differential between wins and losses for The Barometer at each AFL club.

Hall’s long-distance Gallen plan
Barry Hall has revealed how he plans to beat his shorter but more experienced opponent in their much-anticipated bout.

Hall gets kick from little masters
Andrew Moloney is the hot favourite to become Australia’s only current world boxing champion when he battles Brooklyn’s Elton Dharry on the same night that his mate Barry Hall fights Paul Gallen.