
Water Minister Ian Hunter ignored criticism of SA Water in report he used to praise it
EXCLUSIVE: The report that Water Minister Ian Hunter used to praise SA Water on burst mains also shows it fails badly in several areas — and is the nation’s worst major utility for fixing faults.
SA News
Don't miss out on the headlines from SA News. Followed categories will be added to My News.
- Another burst water main, but SA Water is ‘outstanding’
- Adelaide loses 40 million litres a day through leaky, bursting pipes
THE report that minister Ian Hunter used to praise SA Water’s performance on burst mains also shows it is the worst major utility in the nation for fixing faults and the second-worst for litres lost per customer because of pipe failure.
In a bid to silence critics, the Water Minister had highlighted a single statistical table from a 140-page independent report to praise SA Water’s performance as “up there with the very highest” and doing “an incredibly good job”.
While the report revealed that SA Water ranked fourth for the number of water main breaks per 100km of pipe, other findings showed disturbing levels of poor performance across a range of areas.
The National Performance Report into urban water utilities, prepared by the Bureau of Meteorology, found SA Water’s urban services:
LOST more litres per customer than 12 other providers with 100,000-plus customers, except Hunter Water in Newcastle.
TOOK longer (2 hours and 43 minutes on average) than any other provider to restore services.
INCREASED main breaks per 100km of pipe by 22 per cent, the second highest in the nation with the highest 23 per cent.
EXPERIENCED more sewer breaks than any other city.
SPENT one of the smallest amounts of any city service on capital infrastructure.
RECORDED the highest number of sewer breaks per customer.
In terms of how long it took to fixed unscheduled shutdowns of the system, the report states: “SA Water reported the highest result, which at 163 minutes was slightly higher the previous year’’.
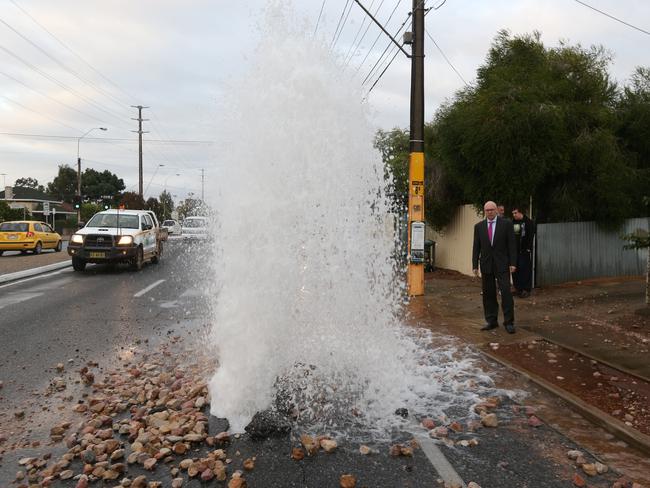
The true picture of the utilities’ performance has emerged as the RAA called for action to cut the number of burst mains, which are regularly causing chaos on busy city roads.
RAA Senior Manager Charles Mountain said that traffic movement across the city was disrupted whenever there was a burst main.
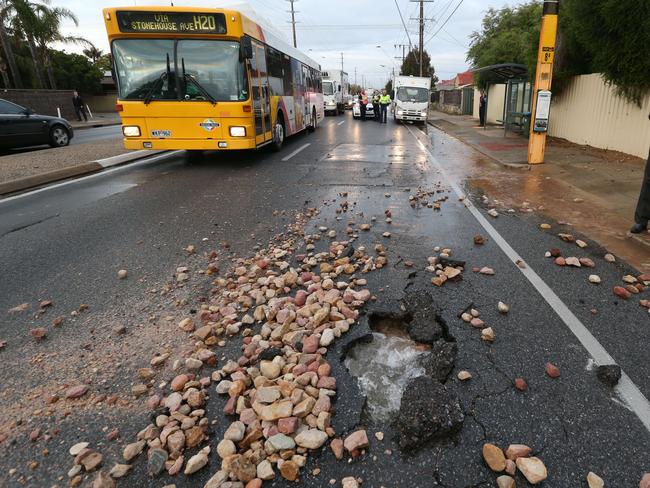
“Adelaide motorists are tired of seeing such significant damage caused to their roads by water mains that haven’t been properly maintained,” he said.
“Many of the burst water mains seem to occur on major arterial roads as well, which makes the immediate impact all the more significant.”
On Wednesday morning, a burst water main shut down Pirie St in the city and on Thursday another burst main restricted traffic on Marion Rd, attracting national media criticism of SA Water’s performance.
In terms of the worsening problem, the report states: “Three utilities reported an increase in the number of water main breaks per 100km of water main from 2013-14: Icon Water (23 per cent), SA Water Corporation (22 per cent), and Water Corporation — Perth (12 per cent)’’.
After media criticism of SA Water following the burst water main in Pirie St this week, Mr Hunter used the Federal Government ranking to praise the utility.
Citing only its fourth place in the number of water main breaks per 100km of pipe in 2014/15 he said: “SA Water’s performance is up there with the very highest”.
SA Water has also used the figure on social media, with one Tweet stating: (The SA Water) ... network has far less bursts than most comparable Australian utilities’’.
Family First MLC Dennis Hood said the reality of the report was that SA Water was “at the bottom of the pack”.
“It appears to be a clear case of SA Water cherrypicking the figures,’’ he said.
“The complete picture is nowhere near as positive as they would have us believe.
“Clearly there are several serious issues which should be addressed where we find ourselves at or near the bottom of the pack when compared to other services.’’
SA Water did not respond to a request for comment.
When asked why the other statistics had been hidden from the public and if he would ask SA Water for an explanation, Mr Hunter said: “The table referred to is produced by the Bureau of Meteorology, and shows that our performance in terms of bursts per 100km of pipe is above most other Australian utilities with networks of greater than 100,000 connections’’.
“There is no more suitable data to refer to when discussing frequency or number of bursts.”
Opposition infrastructure spokesman David Pisoni said the latest burst water main was “an appalling situation” and reiterated his calls for SA Water to front a parliamentary committee.
He said Mr Hunter needed to “get his head out of the clouds”.
“Every day in Adelaide there is a significant burst water main,” he said.
“It’s not good enough for the minister to point to statistics and say there is nothing to see here.
“Every morning there is something new to see in the way of a burst water main here in South Australia.”
The report
Bureau of Meteorology National Performance Report into urban water utilities March 2016, 100,000 plus customers
What the Minister cited
■ SA water ranked 4th best for number of water main breaks per 100km of water pipe, (13.9) compared to the best Unitywater (Queensland Sunshine Coast 3.9), and worst Yarra Valley Water (Country Victorian cities 39.3).
What he failed to disclose
■ Ranked second worst for litres of water lost per customer, 90 litres/year. The Hunter Water (Newcastle) was the worst at 91 litres/year.
■ The second biggest increase in water main breaks per 100km of pipe (22 per cent) with the worst Icon Water (Canberra 23 per cent).
■ The longest time (163 minutes) to reconnect water after an unplanned shutdown, with the lowest Barwon Water (88 minutes).
■ Ranked 7th in capital expenditure per customer to help stop leaks and breaks, with $151. The highest was TasWater at $251.
■ Ranked 10th in capital expenditure per customer to help stop sewerage leaks and breaks, $168 with the highest being Logan (Brisbane) on $573.
■ The worst sewerage breaks and chokes per 1000 properties — 29/year. Hunter Valley Water (Newcastle) was the next worst with 10.2/year.
■ SA water ranked 8th for number of sewerage mains breaks per 100km of water pipe (48) with the best Gold Coast (3.9) and the worst Sydney Water (68.7) and the average 30.
Source: www.bom.gov.au/water/npr/
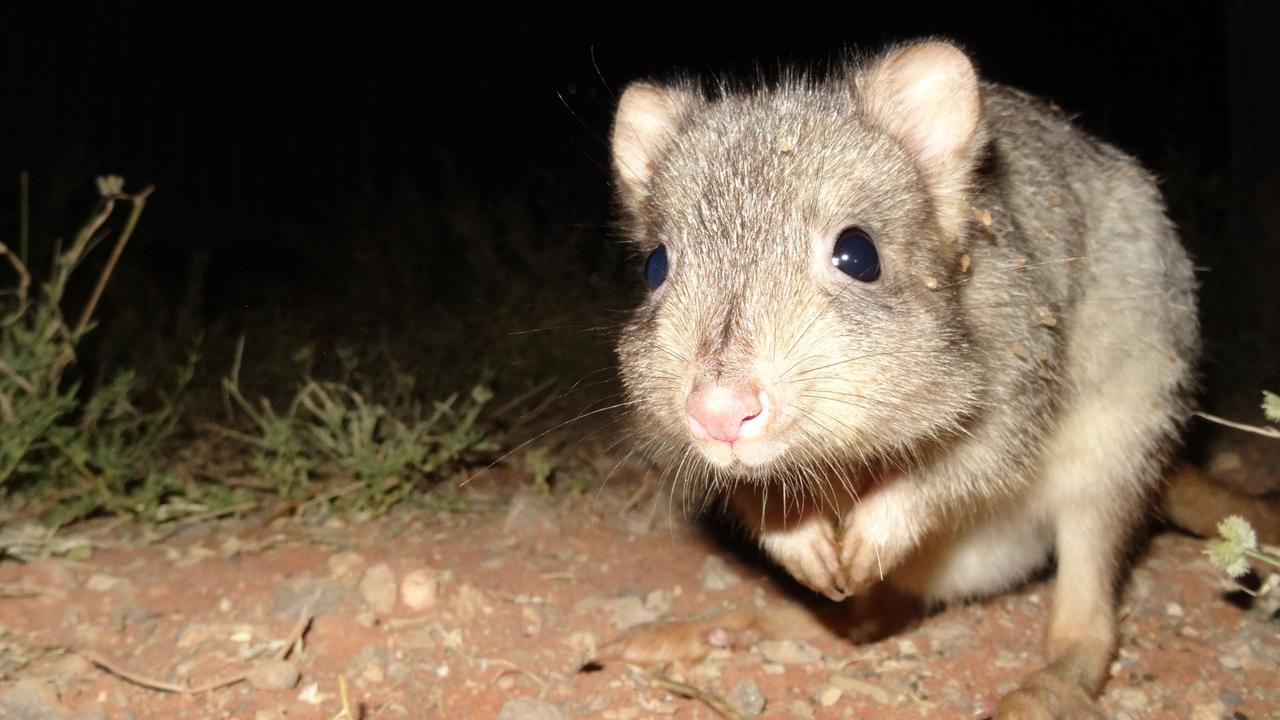
Battle to save animals on the brink at Outback reserve
Conservationists are battling to save animals at an Outback reserve from the effects of the worst drought in recent memory, and have received a funding boost to redouble their efforts.
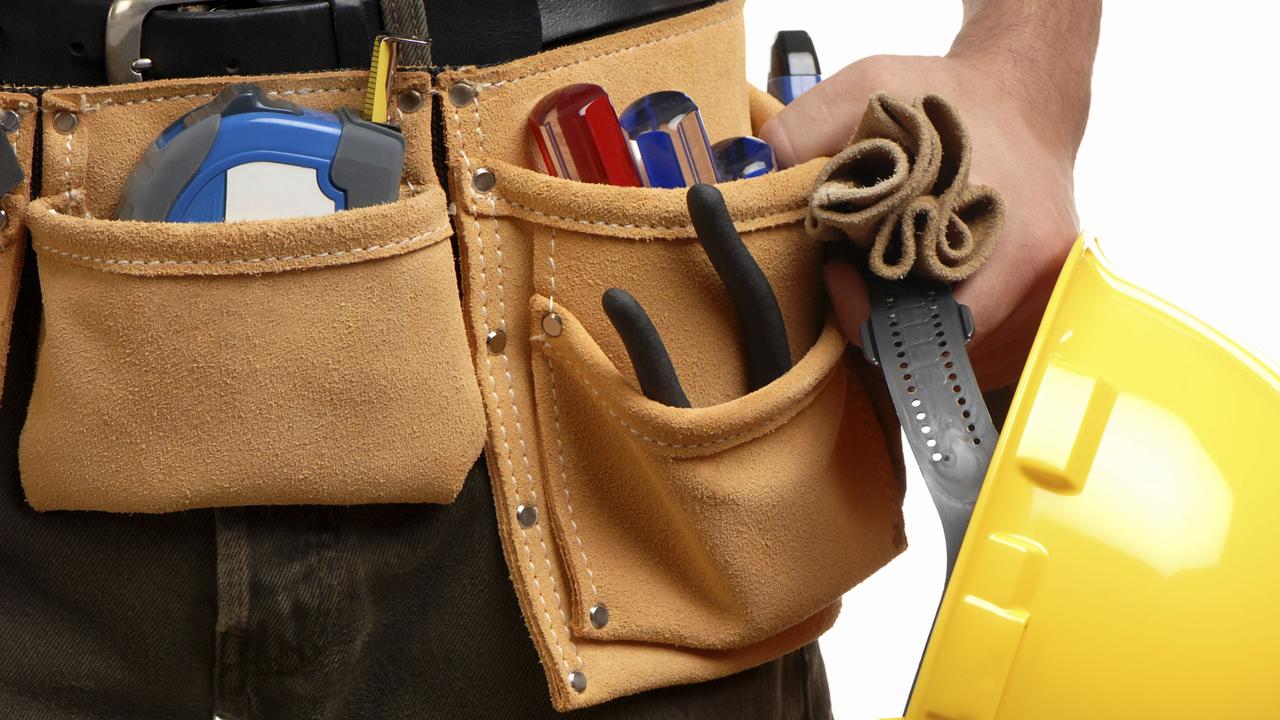
Country tradie to face court over incomplete work
A country tradesman will face the Elizabeth Magistrates Court over allegations he was not licenced and refused to refund money to clients.