
Public schools make up half the top 100 best performing schools in NAPLAN tests in Years 3, 5 and 7
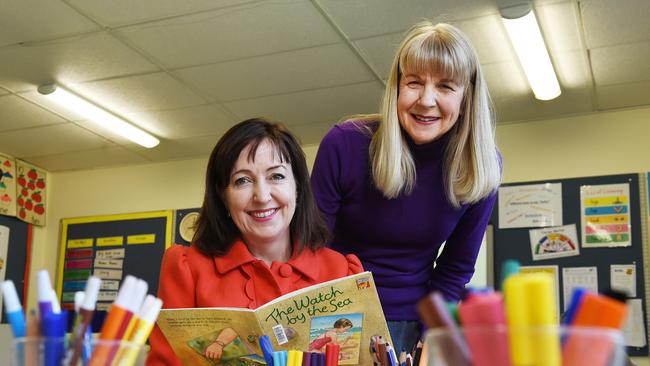
HIGH-performing public primary schools are holding their own against the private sector, an exclusive Advertiser analysis of NAPLAN results has revealed. Explore the data for your school.

SA News
Don't miss out on the headlines from SA News. Followed categories will be added to My News.
SOME primary students are being forced to sit regular practice NAPLAN tests as schools focus on lifting their results, while new analysis shows that high-performing public primary schools are holding their own against the private sector.
As thousands of students get ready to sit the contentious literacy and numeracy tests next month, an Advertiser analysis of 2015 results shows public schools claimed 50 of the top 100 positions in the state in Year 3, and close to half in Years 5 and 7, but just a third in Year 9.
But at the other end of the scale, public schools comprised the overwhelming majority — more than 90 per cent — of the 100 schools with the lowest scores in each of Years 3, 5 and 7.
The breakdown comes amid warnings from principals that the increased public focus on NAPLAN has spawned a new industry of “self-anointed experts” peddling products to parents who want to lift their children’s scores.
Australian Education Union state president Howard Spreadbury said some schools put “a big emphasis on practising”, and he knew of one northern suburbs school where teachers had been told to start preparing Reception students to be “NAPLAN ready” by Year 3.
“I think there are schools where it becomes a bit obsessive, but I’d be loathe to say it’s widespread,” he said.
EXPLORE THE RESULTS FOR YOUR SCHOOL
Viewing this on your desktop device? Click here for even more data.
Paracombe Primary principal Bill Lewis said his school, which recorded strong results last year, did not put any special focus on NAPLAN because it was “just a snapshot” of student performance. But not all schools took the same approach in a system that put “a lot of emphasis on data analysis” at both state and national level.
“We have heard even the last couple of weeks of kids who have been doing NAPLAN practice tests virtually daily,” Mr Lewis said.
The Education Department labelled teaching to the test “counter-productive” and said it was strongly discouraged.
Using data from the federal MySchool website, The Advertiser averaged the scores recorded by each school in the areas of reading, writing, spelling, grammar and punctuation, and numeracy, to produce rankings for each of the four year levels that sit the compulsory tests.

There are more than 500 public schools in the state and around 200 private ones.
SA Primary Principals Association president Pam Kent said teachers were the real education experts, but the focus on NAPLAN had sparked “a profitmaking industry” led by “self-anointed experts in education” preying on parents’ desire to improve their children’s results.
Ms Kent said she would be “truly surprised” if local schools were making regular use of practice NAPLAN tests, though teachers needed to familiarise Year 3s with “test conditions” because they were not used to sitting silently for long periods “filling out a form”.
However, she said American and British research on NAPLAN-style systems found “unintended, negative impact(s) on the quality of teaching and learning” including “large amounts of teaching time consumed by coaching and practising tests”.
The true purpose of NAPLAN testing was to measure students’ “growth in learning”, rather than making comparisons between schools, Ms Kent said.
Education Minister Susan Close backed NAPLAN as a way of motivating schools to improve students’ foundation skills. She said “nothing focuses the mind like public reporting on your performance” through the MySchool site, which provides comparisons with groups of similar schools by levels of “socio-educational advantage”.
However she said league tables comparing all schools were misleading because they largely reflected “parental income and parental education … the strongest indicators of education success”.
“This inequality of outcome is something Australia must tackle head-on. Funding to student need and counterbalancing parental advantage is essential,” she said.
Education Department executive director for learning improvement Susan Cameron said league tables “do nothing more than stigmatise our most disadvantaged schools”.
“NAPLAN is a useful tool to establish a benchmark, but conclusions about individual student development and school performance cannot be made using NAPLAN alone,” she said, adding the need to boost Year 9 performance was a focus not just in SA, but nationally.
DESPITE SMALL SUMS, NUMERACY COUNTS FOR NO. 1
by Tim Williams
A PUBLIC school in the eastern suburbs delivered the best Year 7 NAPLAN results in the state last year.
The Advertiser’s breakdown of the literacy and numeracy test results shows Linden Park Primary not only topped the Year 7 list but also ranked highly in Year 3 (coming eighth) and Year 5 (11th).
And it manages to do it with little more than a third of the gross income per student of the best-resourced private schools.
Principal Vicky Porter attributed the success to motivated students, parents engaged with their children’s education and highly skilled teachers.
“We have a literacy coach working with our teachers to improve in the pedagogy area. We invest a lot in resourcing teacher professional learning like all public schools do,” Ms Porter said.
“There’s no (literacy or numeracy) program you can grab off the shelf that will help all students. It’s about identifying the individual needs of the students and supporting them as best we can.”
Overall the school has a wealthy demographic, but Ms Porter said students came from a wide range of backgrounds. It has become so popular, especially with Chinese and Indian migrant families, that last year it had to start restricting enrolments.
“Our parents value education, that’s known. Our students are very keen to learn and our parents are very engaged in what we are doing,” she said.
“We are proud of our school. We do believe we offer good value and our students work very hard and that shows in our results.”
Ms Porter said students were not given practice NAPLAN tests but were familiarised with multiple-choice tests.
NAPLAN results were useful to measure student progress but had to be analysed in conjunction with other assessments through the year, she said.
ANALYSIS: REAL WORRY FOR THOSE AT THE BOTTOM
by Tim Williams
EVERY parent needs to know how their school is performing in the critical areas of literacy and numeracy teaching.
Those paying top dollar for private education have an understandable expectation that their chosen school should deliver strong results.
And the public school system, which faces the herculean task of delivering equality of opportunity to students, regardless of background, must also be held accountable.
There are mixed results in The Advertiser’s analysis for the public sector. A healthy proportion of state schools are at the top end of the scale in each primary year level involved in NAPLAN testing – half the top 100 in each case – but the poor representation in Year 9 is troubling.
The real worry is at the other end of the performance scale, where public schools dominate the bottom 100 in each year level.
The creation of such league tables will always be controversial.
Education Minister Susan Close, the Education Department and the SA Primary Principals Association all argue they are more a reflection of student background, notably parental wealth and education levels, than of school performance.
Any school’s results can fluctuate from year to year from a weak or strong class. This is particularly the case for small schools with few students in each level, as one or two children having a bad day, or making some lucky guesses, can skew averages.
That is why the tables printed today provide several important pieces of information for context.
Alongside average scores for last year are those from 2014 for comparison, as are enrolment figures and each school’s gross income per student – there are some eye-opening gaps between private and public schools there.
The Australian Curriculum, Assessment and Reporting Authority’s measure of “socio-educational advantage” is also provided for every school.

Battle to save animals on the brink at Outback reserve
Conservationists are battling to save animals at an Outback reserve from the effects of the worst drought in recent memory, and have received a funding boost to redouble their efforts.

Country tradie to face court over incomplete work
A country tradesman will face the Elizabeth Magistrates Court over allegations he was not licenced and refused to refund money to clients.