
Multi-million dollar increase in South Australian councils’ wages bill revealed in leaked research
THE state’s local government wages bill has soared 41 per cent over the past four years, research has found, in contrast to modest rises in the private and public sector. How much is your council spending?

SA News
Don't miss out on the headlines from SA News. Followed categories will be added to My News.
THE state’s local government wages bill has soared 41 per cent over the past four years, research has found, in contrast to modest rises in the private and public sector.
The data, compiled by the state Parliamentary Library, also reveals some local authorities increased “staff expenditure” by more than a third last financial year, despite some reducing staffing budgets. It has prompted calls to reduce the “outrageous” wages growth as councils plan to rake in $1.35 billion each year by the end of their so-called “long-term financial plans” within a decade.
While the lobbying group representing councils disputed the research, campaigners and business groups criticised the “alarming” and “unsustainable” figures amid renewed calls for council amalgamations and rate capping.
The research, commissioned for the Liberal Party’s 29 state MPs, shows that local governmentwage expenditure over the past financial year exceeded $805.2 million. This was a $35.7 million increase on the previous 12 months when wages spending was $769.5 million. This represents growth of almost 5 per cent — more than double the inflation rate.
The wage cost in 2011-12 was $570 million, an increase of 41 per cent over the previous four years.In contrast, between June 2011 and June this year, South Australia’s private sector pay — excluding bonuses and overtime — grew by 13.4 per cent and public wages grew 12.7 per cent, according to Adelaide University’s South Australian Centre for Economic Studies.
In a table of council spending last financial year, revealed in a report by Liberal local government spokesman Steven Griffiths, Roxby Downs Council had the greatest percentage increase, with its wages bill increasing $1.45 million to more than $5 million — an increase of 41 per cent in 12 months.
The Advertiser revealed in June last year that councils were planning a rates-revenue bonanza that will for the first time bring in more than $1 billion in a year. While he did not make a specific recommendation, Mr Griffiths described the increases as “unsustainable”, adding: “It is evident that efficiencies need to occur in local government.”
The Opposition’s acting local government spokesman, Duncan McFetridge, said his party had been contacted by numerous residents concerned with council salary bills increasing “dramatically”. “We are investigating ways to work with councils to drive down costs generally and keep rates as low as possible,” he said.
The Property Council’s SA executive director, Daniel Gannon, called for the State Government to launch an external review into the “efficacy, efficiency and transparency of council decision-making”. He said: “Not only are these increases unsustainable and outrageous, but an explosion in local government salaries ... doesn’t align with reasonable community or business expectations.”
Xenophon Team MP and former SA valuer-general John Darley, who has called for a rates cap, described the figures as “alarming”.
“Councils can set the rate in the dollar to suit whatever expenditure they need and all increases come straight out of ratepayers’ pockets,” he said.
The Local Government Association, which represents the state’s 68 councils, disputed the figures and declined to answer questions about the increasing salaries.
But LGA chief executive Matt Pinnegar said the data appeared to be “deeply flawed” and he would be “very concerned if any political party used such data for policy considerations”.
HOW MUCH DOES YOUR COUNCIL SPEND ON STAFF WAGES?
SA local Government Areas; 2014/15; 2015/16; variance; %
Adelaide CityCouncil: $66,579,000 $70,514,000 $3,935,000 5.9%
Adelaide Hills: 13,532,000 14,807,000 1,275,000 9.4
Alexandrina: 12,697,000 13,846,000 1,149,000 9.0
Barossa: 11,734,000 12,222,000 488,000 4.2
Barunga West: 1,489,092 1,521,010 31,918 2.1
Berri Barmera: 4,462,562 4,636,023 173,461 3.9
Burnside: 14,860,000 15,129,000 269,000 1.8
Campbelltown: 59,012,000 61,479,000 2,467,000 4.2
Ceduna: 2,653,000 2,681,000 28,000 1.1
Charles Sturt 37,384,000 39,295,000 1,911,000 5.1
Clare & Gilbert Valleys : 3,902,000 4,209,000 307,000 7.9
Cleve NA/ NA
Coober Pedy: 3,931,000 5,131,000 1,200,000 30.5
Coorong: 4,638,000 4,951,000 313,000 6.7
Copper Coast: 6,227,000 6,705,000 478,000 7.7
Elliston: 1,031,000 1,123,000 92,000 8.9
Flinders Ranges: 1,543,300 1,500,300 -43,000 -2.8
Franklin Harbour: 960,730 1,248,929 288,199 30.0
Gawler 8,482,000 9,264,000 782,000 9.2
Goyder: 2,140,000 2,518,590 378,590 17.7
Grant: 4,871,452 5,252,869 381,417 7.8
Holdfast Bay: 27,097,986 28,662,310 1,564,324 5.8
Kangaroo Island: 5,213,767 5,194,014 -19,753 -0.4%
Karoonda East Murray: 711,149 760,606 49,457 7.0
Kimba: 1,359,000; NA
Kingston: 1,572,622 1,661,598 88,976 5.7
Light Regional : 6,403,990 6,573,817 169,827 2.7
Lower Eyre Peninsula: 2,437,886 2,535,286 97,400 4.0
Loxton Waikerie: 6,057,000 6,341,000 284,000 4.7
Mallala: 4,740,000 4,517,000 -223,000 -4.7
Marion: 32,777,000 32,139,000 -638,000 -1.9
Mid Murray: 7,300,000 8,303,000 1,003,000 13.7
Mitcham: 21,387,000 22,569,000 1,182,000 5.5
Mt Barker: 12,554,000 13,422,000 868,000 6.9
Mt Gambier: 8,661,000 9,051,000 390,000 4.5
Mt Remarkable: 2,036,000 2,354,000 318,000 15.6
Murray Bridge: 9,517,000 9,792,000 275,000 2.9
Naracoorte Lucindale: 5,634,000 5,431,000 -203,000 -3.6
Northern Areas: 2,708,700 2,912,100 203,400 7.5
Norwood, Payneham & St Peters: 14,016,000 13,957,000 -59,000 -0.4
Onkaparinga: 55,311,404 58,353,046 3,041,642 5.5
Orroroo Carrieton: 1,029,000 1,046,000 17,000 1.7
Peterborough: 1,735,052 1,905,065 170,013 9.8
Playford: 32,657,000 34,236,000 1,579,000 4.8
Port Adelaide Enfield: 34,665,700 37,942,000 3,276,300 9.5
Port Augusta: 16,512,750 17,387,350 874,600 5.3
Port Lincoln: 4,074,142 5,002,791 928,649 22.8
Port Pirie: 6,395,000 6,692,000 297,000 4.6
Prospect: 7,573,563 7,778,314 204,751 2.7%
Renmark Paringa: 3,491,634 3,745,110 253,476 7.3
Robe: 2,014,000 1,973,000 -41,000 -2
Roxby Downs: 3,548,000 5,002,000 1,454,000 41.0
Salisbury: 36,665,000 35,592,000 -1,073,000 -2.9
Southern Mallee: 2,485,000 2,601,000 116,000 4.7
Streaky Bay: 1,849,923 1,995,827 145,904 7.9
Tatiara: 4,055,000 3,913,448 -141,552 -3.5
Tea Tree Guy: 32,278,000 34,035,000 1,757,000 5.4
Tumby Bay: 1,668,500 1,682,600 14,100 0.8
Unley: 16,169,000 16,576,000 407,000 2.5
Victor Harbor: 7,956,000 8,389,000 433,000 5.4
Wakefield: 3,484,355 3,618,912 134,557 3.9
Walkerville: 2,602,000 2,906,000 304,000 11.7
Wattle Range: 7,376,718 7,592,214 215,496 2.9
West Torrens: 26,232,000 27,071,000 839,000 3.2
Whyalla: 10,452,923 10,558,941 106,018 1.0
Wudinna: 1,210,867 1,325,723 114,856 9.5
Yankalilla: 4,004,000 4,189,000 185,000 4.6
Yorke Peninsula: 7,663,000 7,924,000 261,000 3.4
Source: Parliamentary Library research for the Liberal Party
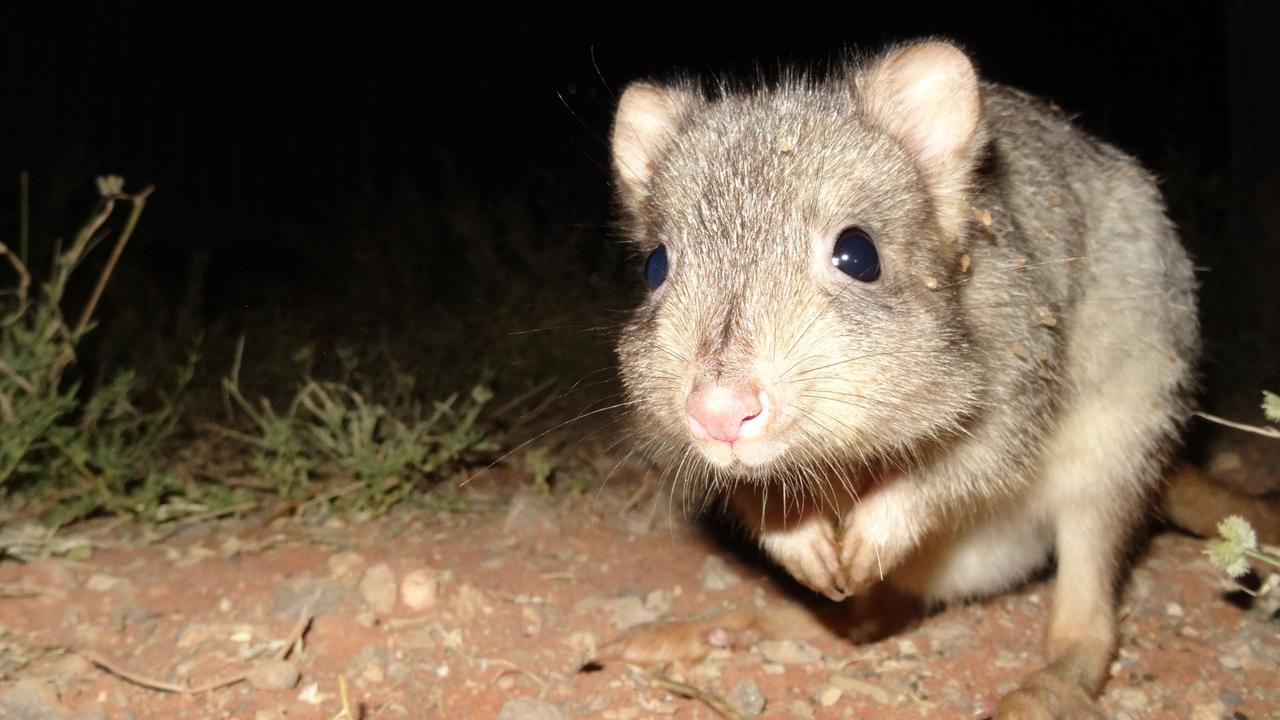
Battle to save animals on the brink at Outback reserve
Conservationists are battling to save animals at an Outback reserve from the effects of the worst drought in recent memory, and have received a funding boost to redouble their efforts.
Read more
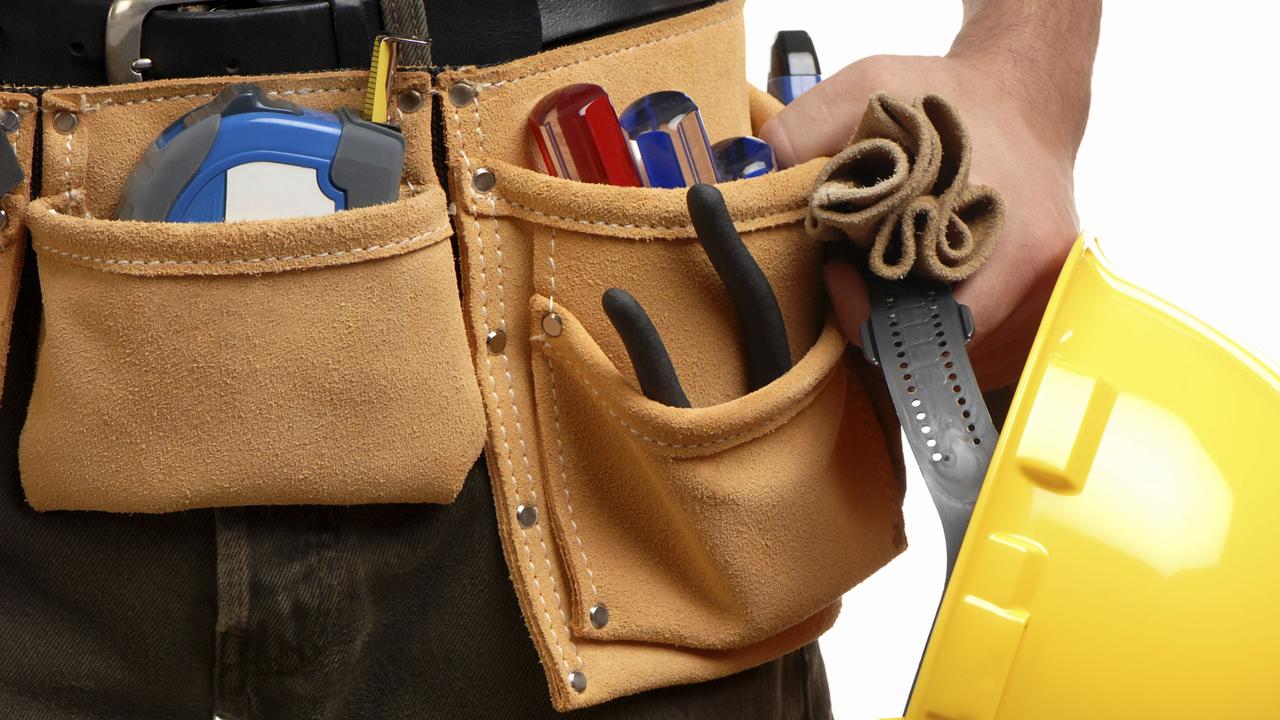
Country tradie to face court over incomplete work
A country tradesman will face the Elizabeth Magistrates Court over allegations he was not licenced and refused to refund money to clients.
Read more