
Mapped: Modelling shows what will go underwater at 120GL, 140GL and 160GL daily flows into River Murray
New modelling predicts dozens of shacks will be flooded when the River Murray peaks in December. From Renmark to Murray Bridge, explore the areas most at risk.
Dozens of riverside shack properties at several popular tourist destinations will be inundated when the River Murray reaches its highest level in 50 years in December.
Flood maps released by the Department of Environment and Water show areas likely to go underwater in three scenarios – a flow of 120,000ML/day, 140,000ML and 160,000ML.
The maps reveal that shack owners at several popular towns including Morgan, Blanchetown, Swan Reach and Mannum will bear the brunt of the damage.
Many shack properties will be flooded when the level reaches the department’s initial ‘conservative’ estimate flow of 120GL a day, more will go under if the flow reaches 140GL a day, and even more at 160GL/day.
On Thursday, the department said the Riverland doesn’t “have very long” to prepare for a huge amount of water flowing into the system – with new predictions increased to 135GL a day.
Most river shacks and homes are built on stilts and the flooding is unlikely to reach their main living, sleeping and dining areas, but owners will spend the next few weeks sandbagging to protect their lower levels.
Department for Environment and Water manager of water delivery Chrissie Bloss said worst-case scenario modelling showed that “properties, paddocks, lower lying shacks, caravan parks and community facilities, including parks and sporting areas, may be inundated” by floodwaters.
But Ms Bloss said towns along the River Murray were unlikely to suffer from the large-scale flooding seen interstate.
“Most South Australian townships along the River Murray are located either outside the floodplain or on higher parts of the floodplain and therefore it takes a much larger flow for towns to be affected,” she said.
Ms Bloss said it was impossible to say just how long the elevated river flows would affect the region.
“River Murray flows will be elevated for months and it is estimated to be above 100GL a day for three to four weeks, but we will know more as the peak gets closer,” she said.
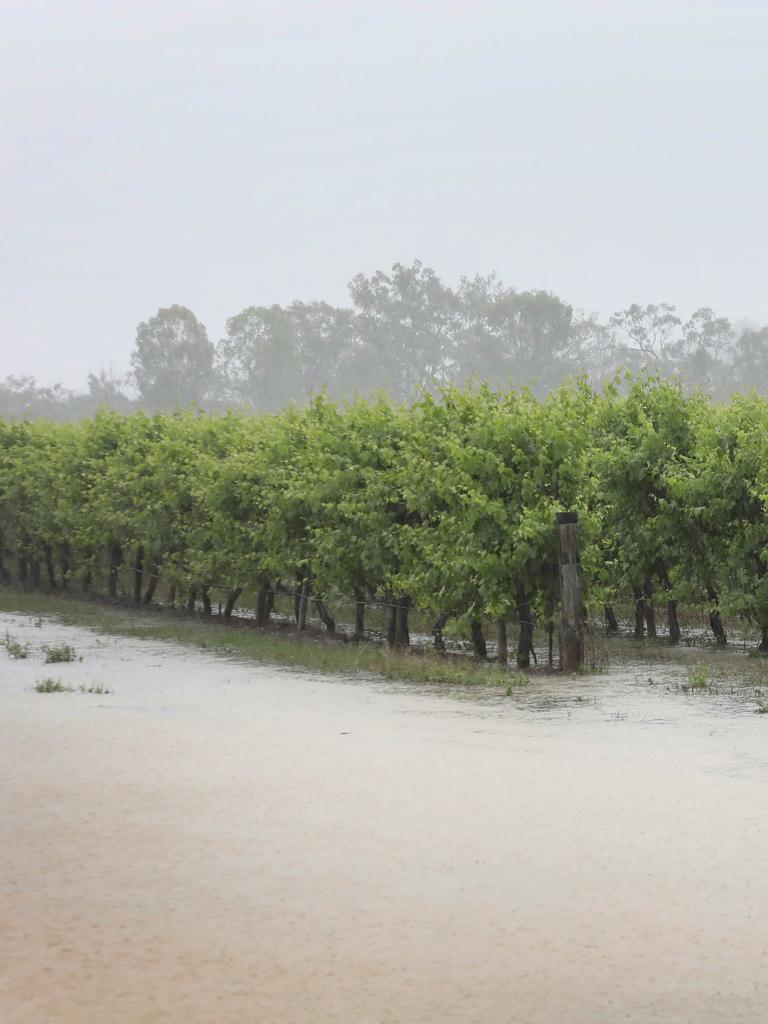
Ms Bloss said that the torrential rain that caused localised flooding in the Renmark area would not significantly contribute to river levels. But locals are eagerly awaiting the latest official predictions, which will take into account heavy rain in the eastern states this week.
Climate, Environment and Water Minister Susan Close said the DEW had established a dedicated web page to answer questions on the flooding situation.
“We are talking about flow levels not seen in SA for close to 50 years, so it’s important for the community to have all the information and tools readily available to help them prepare,” Ms Close said.
The flow will be the highest since 1974, when it was 180GL a day at the SA border. The 1956 flood, which was the largest recorded, peaked at 341GL a day at its worst.
Explore the maps below.
KEY TO THE MAPS
120GL/day: This was the initial department forecast for what the the flow will reach at the SA border in early December.
140GL/day: Latest estimates predict a peak of 135GL a day, so these maps are more likely.
160GL/day: Current advice shows a “low probability” that flows would reach this level.
Note for app users: Double-tap to zoom in and move around the maps, or use the links below each embed to open in full-screen mode.
LOXTON
MANNUM
MURRAY BRIDGE
BERRI
BLANCHETOWN
MORGAN
RENMARK NORTH
RENMARK SOUTH
SWAN REACH
WAIKERIE
Join the conversation

Flatmate attacked in wild stabbing over cricket
Read more

Fraudster ex-lawyer back in jail after another wild spiral
Read more