
Cashed-up or cash-strapped? Search our database of every SA school to find total income and funding per student
We’ve mapped the total income of every SA school and compared their funding levels per student — and the results show many of our “poorest” schools are in surprisingly wealthy areas.
Adelaide’s richest independent schools generate up to three times as much income per student as many public schools, latest data reveals.
Advertiser.com.au today publishes income figures for all South Australian schools in the latest instalment of our ongoing schools data series.
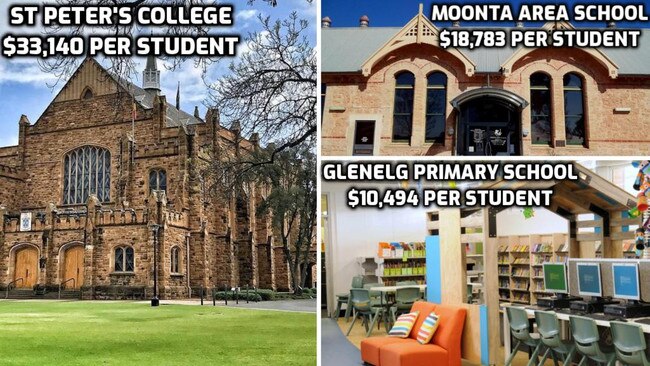
Elite boys school St Peter’s College raked in $46.3 million in 2017, at an average of $33,140 for each student.
More than 400 public and private schools, well over half the total in the state, operated on less than half the per student amount of St Peter’s.
Next at $29,378 was all-girls Seymour College, followed by other high-fee schools Pembroke on $28,372 and Prince Alfred College on $28,068.
Gross income, as recorded on the federal MySchool website, includes recurrent state and federal funding, as well as parent fees and other private sources including donations. It excludes government funding for capital works.
Scotch, Pulteney, Westminster, St Peter’s Girls, Wilderness, Walford and Immanuel were also among the top tier of high-fee independent schools that brought in at least $26,000 per student.
While St Peter’s College declined to comment and Seymour said its senior staff were unavailable, the most common arguments to justify private school income levels are that parents contribute a lot more in fees, and those schools generally have to fund building projects themselves.
Among independent schools, St Mark’s Lutheran at Mt Barker was lowest at $11,976 per student.
The top 25 schools for per-student revenue were all public, nearly all Aboriginal and other remote schools with very small enrolments. Their per-student incomes ranged from $34,000-$62,000, with three above $100,000.
By comparison, some public schools ran on as little as $10,040 a year per student. Close to 40 of them, mostly in Adelaide and all primary schools, survived on less than a third of what St Peter’s College generates.
Many are in well-to-do areas, including Stirling East, Belair, Parkside, Mitcham, Glen Osmond, Prospect and Glenelg primary schools.
Asked how schooling could be equitable when some have so much more money than others, Education Minister John Gardner said resourcing had to “provide each child with the opportunity to maximise their development”.
He said recurrent State Government funding would rise by $611 million by 2022-23 and noted “the overwhelming majority” of funding went to public schools.
In Adelaide’s Catholic sector, Loreto College led the way on $24,438, ahead of St Ignatius, Mercedes, Our Lady of the Sacred Heart, and Rostrevor colleges, all above the $21,000 mark. St Thomas’ School at Goodwood ran on the lowest amount of $11,360.
Catholic Education SA director Neil McGoran said funding was determined by the national School Resource Standard, with higher levels for disadvantaged schools.
He said private school fees reflected parents’ “capacity to pay”, and school running costs varied due to, size, location, and student needs.
READ MORE: The Advertiser’s new Education hub