
SA’s Covid-19 breakdown: The LGAs with the highest number of infections revealed
Fresh data reveals the state’s worst Covid-19 hot spots as case numbers increase following the start of Fringe season. Find out how many active cases there are in your area.


Coronavirus
Don't miss out on the headlines from Coronavirus. Followed categories will be added to My News.
South Australians can rest assured daily case numbers are not spiralling as in January, but Covid-19 remains in the community.
Days after the opening of the Adelaide Fringe, there were 1958 cases reported on Wednesday, which is significantly higher than most daily numbers reported this month.
On Thursday there were 1735 new cases reported in South Australia, a slight decline and on Friday daily cases fell by 21 to 1,714 patients.
About 112 patients were being treated in hospital – down 30 cases in the past 24 hours while the number of people in ICU is stable.
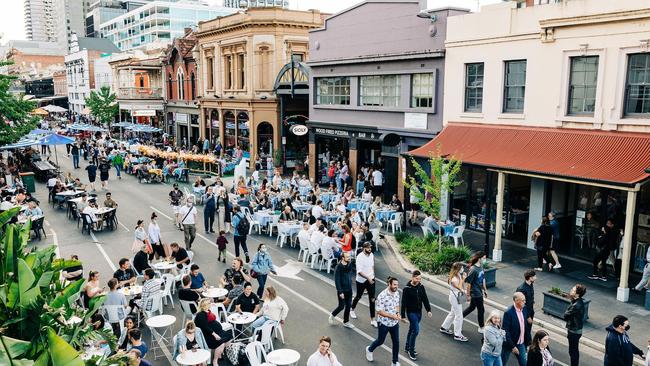
It comes as an Adelaide bar has been fined after it filmed people dancing and not wearing masks, posting the breach on Instagram.
Updated daily local government area case numbers reveal Covid-19 is continuing to spread through some populated areas more than others.
The Salisbury local government area has the highest number of active cases with 1692, followed by Playford with 1413, Onkaparinga with 1392, and Charles Sturt with 1149 cases.
How’s your neighbourhood faring? Read the full figures released by SA Health below and for further analysis see our metropolitan heat map.
Active cases as of February 25
ADELAIDE 727
ADELAIDE HILLS 276
ALEXANDRINA 87
ANANGU PITJANTJATJARA 60
BAROSSA 116
BARUNGA WEST 5
BERRI AND BARMERA 74
BURNSIDE 271
CAMPBELLTOWN 460
CEDUNA 16
CHARLES STURT 1149
CLARE AND GILBERT VALLEYS 35
CLEVE 6
COOBER PEDY 34
COPPER COAST 61
ELLISTON 1
FLINDERS RANGES 11
FRANKLIN HARBOUR 11
GAWLER 176
GOYDER 63
GRANT 42
HOLDFAST BAY 340
KANGAROO ISLAND 3
KAROONDA EAST MURRAY 5
KINGSTON 4
LIGHT 106
LOWER EYRE PENINSULA 28
LOXTON WAIKERIE 96
MALLALA 137
MARION 930
MID MURRAY 40
MITCHAM 468
MOUNT BARKER 374
MOUNT GAMBIER 156
MOUNT REMARKABLE 14
MURRAY BRIDGE 206
NARACOORTE AND LUCINDALE 65
NORTHERN AREAS 13
NORWOOD PAYNEHAM ST PETERS 256
ONKAPARINGA 1392
ORROROO/CARRIETON 3
PETERBOROUGH 1
PLAYFORD 1413
PORT ADELAIDE ENFIELD 1079
PORT AUGUSTA 316
PORT LINCOLN 158
PORT PIRIE CITY AND DISTS 53
PROSPECT 270
RENMARK PARINGA 92
ROBE 6
ROXBY DOWNS 26
SALISBURY 1692
SOUTHERN MALLEE 10
TATIARA 26
TEA TREE GULLY 923
THE COORONG 26
TUMBY BAY 5
UNINCORPORATED SA 11
UNLEY 205
VICTOR HARBOR 83
WAKEFIELD 56
WALKERVILLE 72
WATTLE RANGE 39
WEST TORRENS 489
WHYALLA 245
WUDINNA 2
YANKALILLA 20
YORKE PENINSULA 35


‘It can be fatal’: Health warning for SA babies as RSV spike climbs
A health alert has been issued to SA parents after a shock spike in RSV cases presenting to emergency rooms – with more than half being young children under the age of 5.
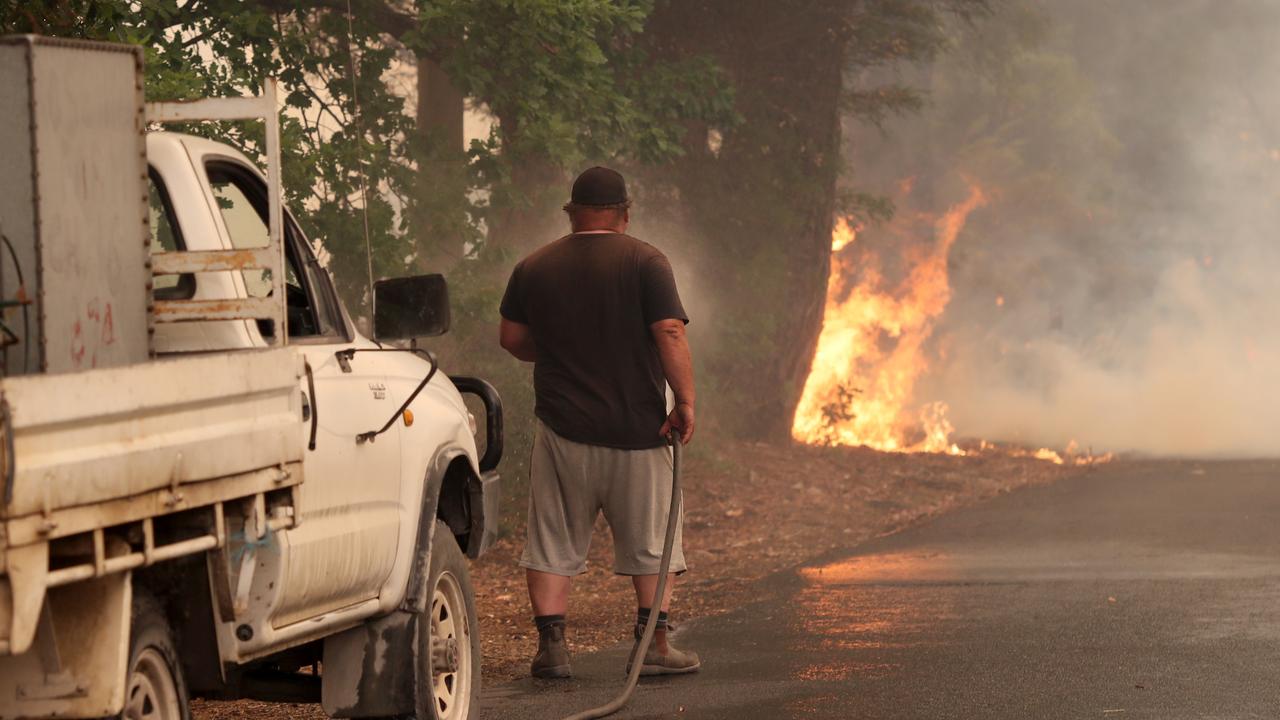
New emergency ‘threats’ putting SA at risk, landmark inquiry finds
The Covid pandemic, River Murray flood crisis, bushfires and statewide blackout were all declared major emergencies over past 20 years. Now, a major inquiry identifies new threats risking state.