
This is how much super you really should have by now
Australians spend a lot of time worrying about super. Well, this is the exact amount you really should have in your super account.

Super
Don't miss out on the headlines from Super. Followed categories will be added to My News.
ANALYSIS
Australians spend a lot of time worrying about their super.
I’m going to show you the average super balance for someone your age. Then I want you to forget it.
Here’s the chart, it shows that the average 30 year old has well under $100,000, the average person in the early 40s has just over $100,000, the average person in their early 50s has a bit over $200,000 and the average person over 65 has over $400,000.
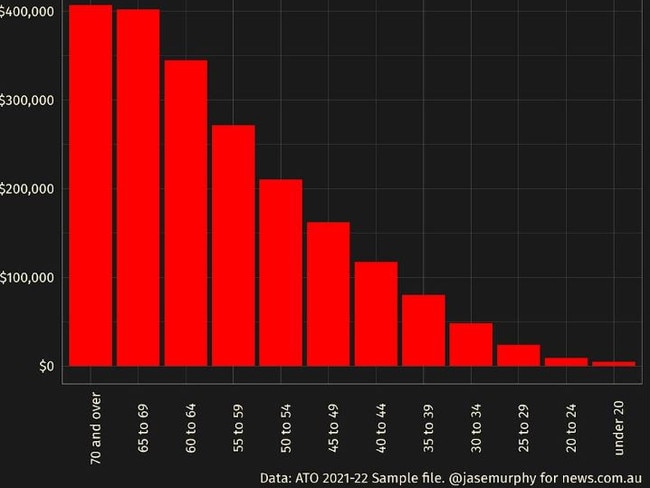
MORE: Can you use superannuation to buy a house?
But this is kinda dumb. Averages are useful for understanding things like height where people are all pretty even.
Superannuation is not like height! Instead lots of people have no super, and some people have absolutely crazy amounts of it.
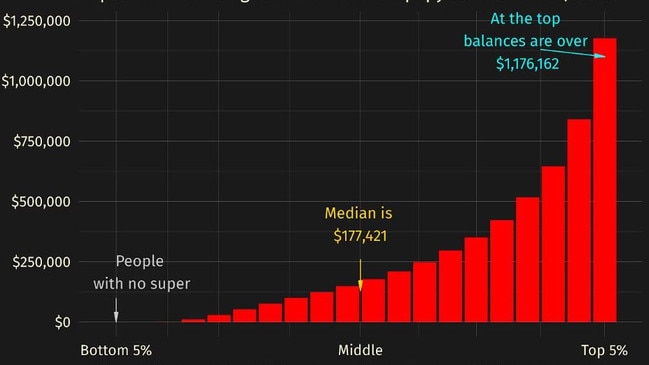
Let’s check in on the 60-somethings. Remember we said the average amount of super was $400,000? Well here’s the thing.
The average is not actually a common amount for 60-64 year olds to have. A lot of them have way less than that. But some have way more, as the next chart shows.

Each red bar is 5 per cent of taxpayers. So we have 20 groups of 60-64 year olds in the graph, ranked from least super at the left to most super at the right.
The top 5 per cent have more than a million dollars in super.
We can see the median, or the amount in the middle, where half have more and half have less. I gave that a gold-coloured label on the chart. If your super account contains $177,421 you’re at the median.
Some important things to know here: this is the latest detailed data out of the ATO but it is not current, it’s from 2022.
The shape of the balance distribution will be the same but the dollar values will have gone up. Height of red bar represents minimum threshold for entering that group. Which is perfect for understanding how the money is spread out, except for the top group.
Inside the top 5% all the balances are higher than $1.176 million, and sometimes far higher. In fact, the distribution inside the top 5% is similarly unequal to the distribution overall. One Australian famously has over $400 million in super!]
What’s important about this way of laying out the data is it reveals how unequal super is.
Most articles about super just lay out the averages by age group and they don’t reveal the secret truth: super is a form of wealth that is highly uneven.
That can leave people freaking out and worrying they don’t have enough. They spend ages stuffing their super accounts when they might actually be better using that money in the here and now.
Certainly the superannuation industry would like people to put more and more money in their accounts, they want to create that FOMO feeling!
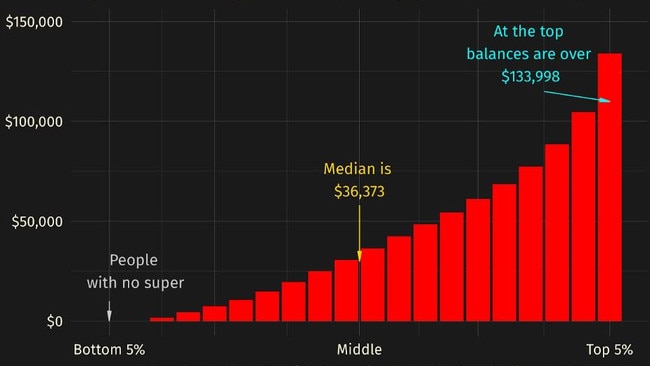
Here’s the chart for people in their early 30s. if you’ve cracked $140,000, you’re in the top 5 per cent (remember this data is from 2022, the figure is probably a touch higher now).
Many people go through their life feeling like being on the pension is a fate worse than death; they worry everyone else has so much super that the government might shut down the pension any old day now.
What these charts hopefully show you is … nah. The pension is going to be with us for a long time.
A huge number of Australians have an amount in super that means they will be using the pension at some point after retirement. And the pension is $1585 a fortnight for a couple, $792.50 for a single. If you own a house that’s far from a poverty wage.
The pension age rose from 65 to 67, it is not scheduled to rise any more. And it is indexed to inflation so its value is maintained.
Too much super
Is it possible to have too much super? They say you can’t be too rich!
But certainly some people have enough super that their balance goes up after they retire. Imagine your super makes $100,000 in investment returns every year. If you spend $50,000 a year on groceries and bills, you are spending only half of your earnings and your super balance will rise.
Let’s see how that looks for groups over retirement age: Over 70, 65 to 69 and 60-64. The next chart is three charts put together. The important thing to notice is that low balances get lower after retirement and high balances get higher.
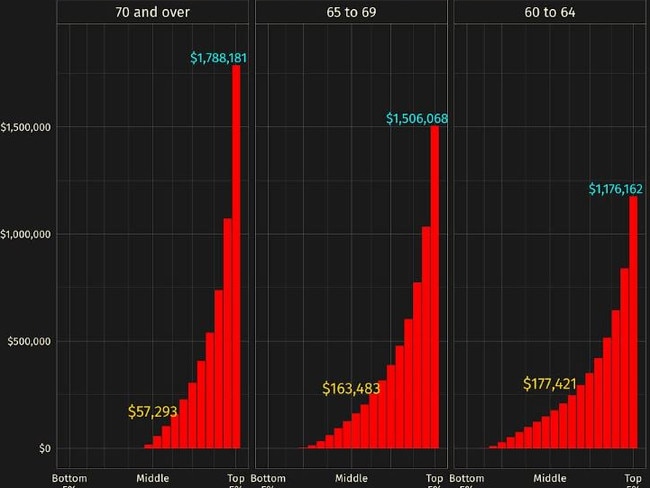
The panel in the left is the oldies – taxpayers over 70. There’s loads of them with no super by the time they’re over 70. And the median (gold label) is falling as people spend their super. But the super balances of the top 5 per cent are actually rising! Perhaps some are still making contributions but most are just making money faster than they can spend it.
This benefits their heirs, who are probably going to get this money in the next 20 years.
Most likely it arrives when the heirs are deep into their 50s, and barely moves the needle on their wealth – the sort of people whose parents have millions in super probably have a lot of assets themselves!
The last thing I want to do in this piece is share with you guys the whole picture of all the age ranges. The next few charts are like the one above, with three-in one.
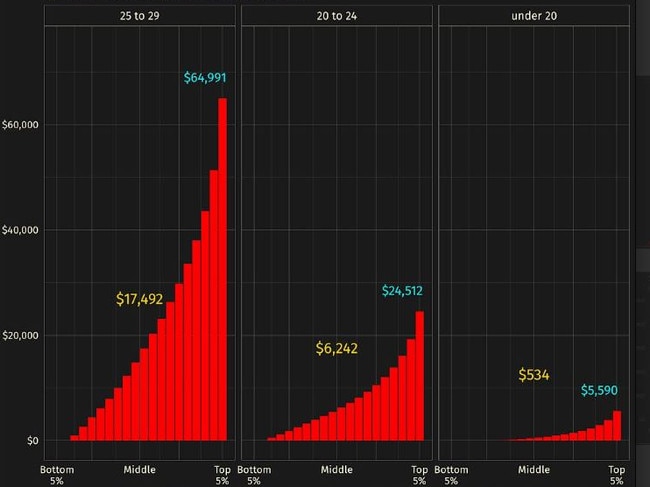

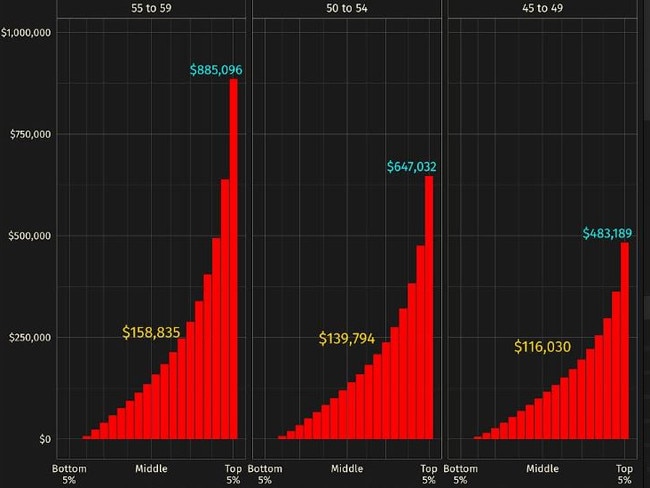
They cover all the age groups and if you look closely you can figure out where your super balance sits.
For example, if you’re 22-years-old, you’re in the middle chart of this group of three, and if you have $20,000 in super, you’re in the second red bar, putting you in the top 10 per cent.
But if you have the same amount at 27, that’s only the median.
The point of this piece has been to hopefully put your mind at ease – the numbers we like to compare ourself to are very high!
Jason Murphy is an economist | @jasemurphy.bsky.social. He is the author of the book Incentivology


Originally published as This is how much super you really should have by now

Superannuation mistakes to avoid making this month
The end of financial year is looming and there’s plenty you can do to maximise your investment returns. Just don’t get caught in this common trap.
Read more

Albo’s impossible choice on super tax
The Prime Minister says he will “obviously work with different parties” as the Coalition seeks a fight on the proposed super tax.
Read more